


1. Introduction
2. Materials and methods
2.1 Study site
2.2 Water sampling and analyses
2.3 Greenhouse gas collection and measurement
2.4 Geographical analysis and Statistical analysis
3. Results
3.1 Patterns of riverine dissolved N2O concentration and fluxes
3.2 Variation of physicochemical properties
3.3 Influence of land cover and physicochemical controls on N2O
4. Discussion
4.1 Patterns of riverine dissolved N2O concentration and fluxes
4.2 Weak relationship between N2O and physiochemical variables
4.3 Implications and limitations
5. Conclusion
1. Introduction
Rivers are significant sources of nitrous oxide (N2O) emissions, with global estimates ranging from 72.8 to 291.3 Gg N y−1 (Marzadri et al. 2021). Although emitted in smaller quantities, nitrous oxide (N2O) is a potent greenhouse gas, with a global warming potential that is 273 times greater than that of carbon dioxide over a 100-year timescale (Forster et al. 2023). The riverine N2O emissions intensity varies greatly due to their sensitivity to heterogenous habitats (Wang et al. 2022). Investigating the influencing factors of N2O emissions in river networks is imperative for accurately estimating emissions and establishing mitigation strategies.
In lotic ecosystems, nitrification and denitrification are the main biogeochemical processes that produce N2O (Quick et al. 2019). Nitrification is a chemoautotrophic process in which dissolved carbon dioxide is fixed by ammonium-oxidizing bacteria that ultimately convert NH4+ to NO3-, releasing N2O in the process (Harrison and Matson 2003). In addition, heterotrophic nitrification of organic N producing N2O has been reported in soil with high C: N ratios (Helton et al. 2015). Nitrification rates can be controlled by NH4+ availability and indirectly through competition for NH4+ with heterotrophic bacteria when C availability is high (Mwanake et al. 2019). For denitrification, N2O is produced as an intermediary by heterotrophic bacteria that reduce NO3- to N2 in anaerobic conditions. Consequently, dissolved organic carbon availability, NO3-, and dissolved oxygen are possible controlling factors (Inwood et al. 2007).
At a catchment scale, land use changes and anthropogenic activities further regulate riverine N2O concentrations and fluxes by altering the input of reactive N and organic carbon to rivers (Zhang et al. 2023). Rivers flowing through catchments dominated by agricultural land (cropland and pastures) had higher N2O levels than forested catchments, likely due to excessive N inputs from fertilizers (Borges et al. 2018). Urban areas exhibited the highest diffusive N2O fluxes, followed by sandy lands and grasslands (Hao et al. 2021). These studies highlight the influence of different degrees of human impact on N2O fluxes, presumably caused by N and organic carbon inputs.
In African tropical rivers, very few studies have been conducted to either quantify emissions or explain the factors controlling them (Borges et al. 2015, Mwanake et al. 2019). The sub-Saharan African rivers represent ~12% of the global stream surface area (Raymond et al. 2013), positioning them as a potential critical component of the global N2O flux. However, uncertainties remain in the amount of N2O flux from river networks in the region. With agricultural intensification in Africa, the risk of increased N2O emissions from streams in the region is increasing. To our knowledge, there is a lack of studies investigating the riverine N2O emissions in Madagascar, which is the largest tropical island of the African continent (Deschamps et al. 2023). This study addresses this critical gap by quantifying N2O fluxes and concentrations from Ikopa streams while determining the influence of land use and in situ water physicochemical properties on controlling N2O dynamics.
2. Materials and methods
2.1 Study site
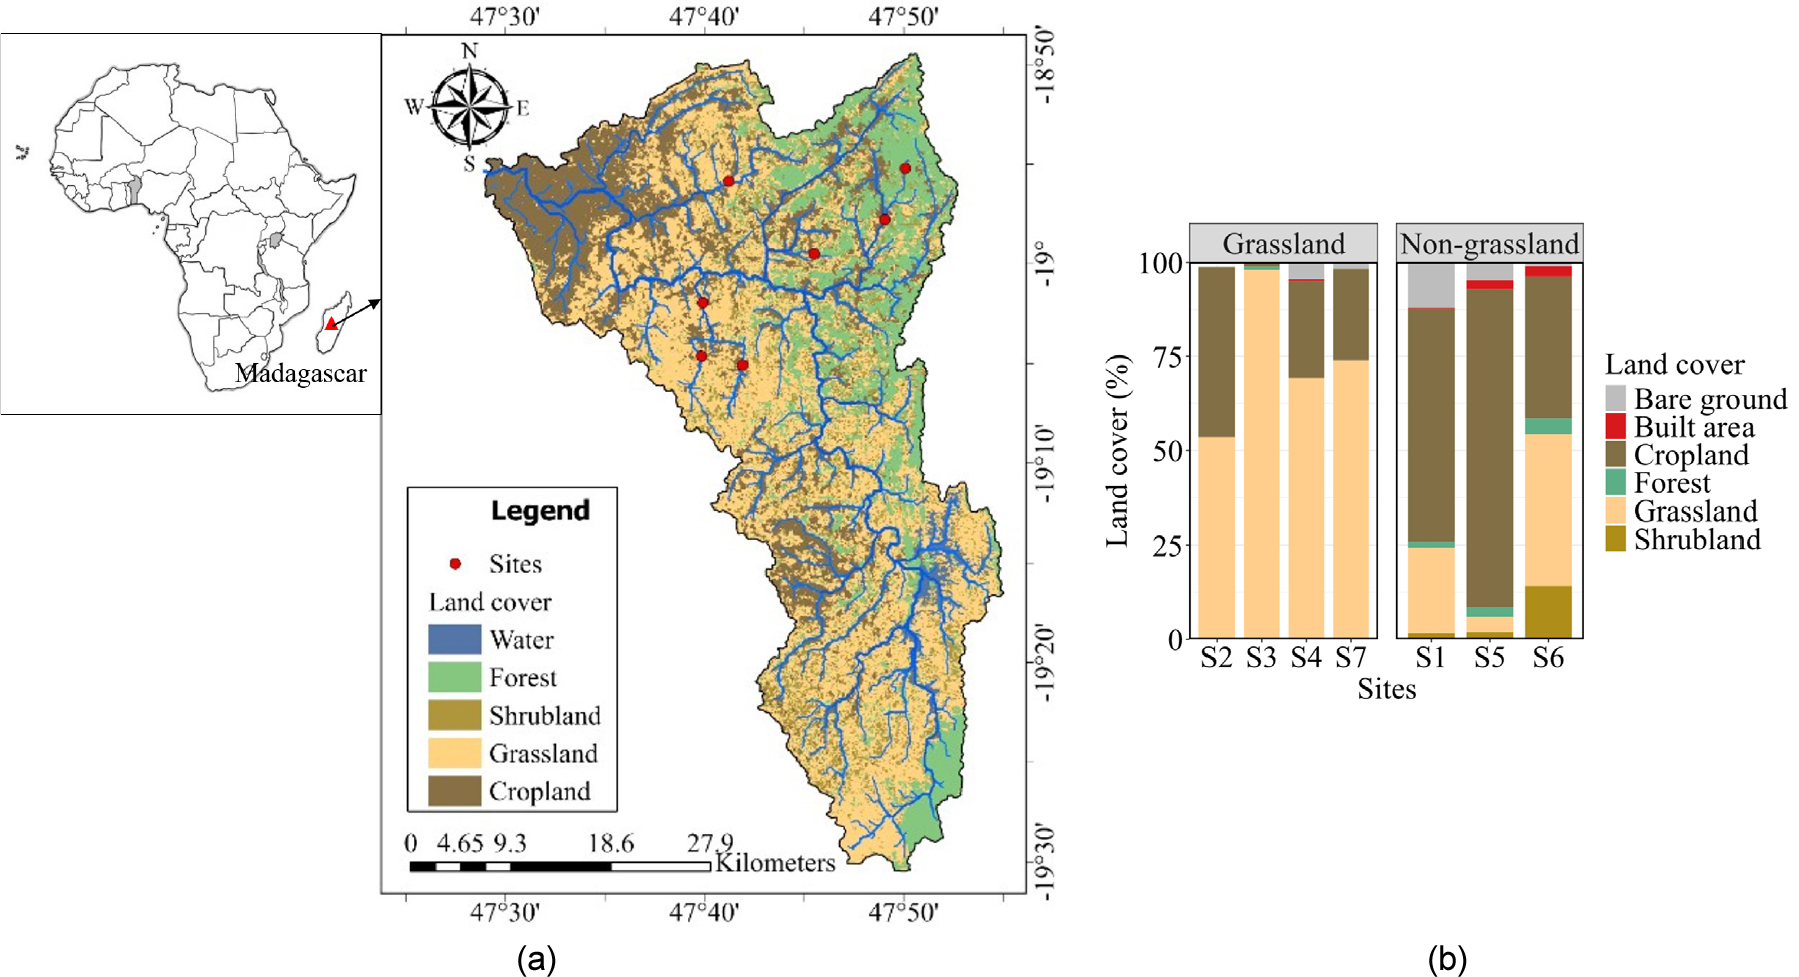
The study was conducted in the Ikopa River network located in the central highland of Madagascar’s grassland. The Ikopa River drained a watershed of 1,622 km2 with an average elevation of about 1,300 m above sea level (Fig. 1). The main channel of the river spans 299.33 km and experiences a tropical climate characterized by a warm, rainy season from November to April, followed by a cooler, drier season from May to October. Annual average precipitation ranges from 1,330 to 1,906 mm. The watershed is underlain by granite bedrock covered by a thick lateritic layer. According to the literature, the sediment texture of the Ikopa River can be composed of clay (Raunet 1980) or silty clay (D’Arifat et al. 2019, Randrianantoandro et al. 2014). The sampling campaign was carried out during the first two weeks of November 2022, corresponding to the onset of the wet season. Seven sites distributed across the Ikopa River network were visited and sampled once during the daytime (10:00 AM – 4:00 PM). No rainfall events occurred during the sampling campaign, and all sites were sampled under comparable non-stormflow conditions.
2.2 Water sampling and analyses
The water temperature, pH level, and conductivity were measured in situ with portable field probes (HI 991300, Hanna Instrument, Romania). Moreover, the surface water dissolved oxygen and turbidity were determined with a portable DO meter (HI 9147, Hanna Instrument, Romania) and a turbidity digital meter (TES Digital turbidity meter 1386, Taipei, Taiwan), respectively. Hanna multiparameter probes were calibrated according to the manufacturer’s specifications.
The surface water for total phosphorous (TP) and total nitrogen (TN) contents was sampled with 30 mL acid-washed High-Density Polyethylene (HDPE) plastic bottles at 10 cm below the surface water, while water samples used for dissolved organic carbon (DOC), ammonium (NH4+), and nitrate (NO3-) were filtered using 0.45 µm polyethersulfone (PES) syringe filters, and collected respectively into 20 mL glass bottles and 80 mL acid-washed HDPE plastic bottles. Concentrated sulfuric acid (2 mL) was added for sample preservation (Zhang et al. 2020). The bottles were stored inside a portable cooler (-4°C) filled with ice packs and then frozen (-20°C) until further analysis in the laboratory. A HUMAS water kit analyzer made in South Korea using the colorimetrical method and a UV-spectrophotometer (UV- visible spectrophotometer T60, UK) was used to quantify the TP (HS-TP-L, range 0.01 to 3 mg. L-1), TN (HS-TN-U, range 0.02 to 5 mg. L-1), NH4+ (HS-NH3(N)-U, range 0.03 to 1 mg. L-1), and NO3- (HS-NO3(N)-L, range 0.2 to 5 mg. L-1) contents in water, and the DOC concentration were estimated with the Total organic carbon analyzer (TOC-L Shimadzu, Kyoto, Japan) by Non-Purgeable Organic Carbon.
2.3 Greenhouse gas collection and measurement
Dissolved N2O concentrations were measured using the headspace equilibration method. In the field, a 60 mL syringe fitted with a three-way stopcock was used to equilibrate 40 mL of stream water sampled at wrist depth with 20 mL of ambient air (Tang et al. 2021, Weiss and Price 1980). After the syringe was vigorously shaken underwater for 1 minute, 20 mL of the headspace was immediately transferred into vacuum glass tubes (Labco Exetainer®, 12 mL, Buckinghamshire, UK) (Billett and Moore 2008). Ambient air was also collected using a 20 mL syringe, then it was injected into vacuum glass tubes, and triplicate samples were collected and analyzed at each site. Before analyzing the gas samples with a gas chromatography equipped with an electron capture detector (uECD, ChroZen GC System, Youngin Chromass, South Korea), the apparatus was calibrated with standard N2O gases ranging from 1 to 10 ppm. Water temperature and atmospheric pressure were recorded via a 1450 micro station data logger (Spectrum Technology 3684 WDI, Illinois, USA), a temperature sensor (Spectrum Technology 3684 WDI, Illinois, USA), and a barometric pressure sensor (Spectrum Technology 3671, Illinois, USA).
The headspace equilibrium method was used to quantify the dissolved N2O concentrations in the stream water, while the floating chamber method was used to assess diffusive N2O fluxes as well as the CH4 ebullition from streams (Zhang et al. 2020). At each site, three identical floating chambers were made of inverted 30 L buckets, and they were covered with aluminum foil to reflect sunlight and minimize internal heating (Zhang et al. 2020). After mixing the gas contents of the chambers three times with a 20 mL syringe, 20 mL of gas samples were extracted and injected into vacuum tubes at 0, 5, 10, 20, 40, and 60-minute time points (Crawford et al. 2013). By analyzing each collected gas concentration with gas chromatography, the N2O concentration variations over time are recorded (Wang et al. 2021). The diffusive fluxes were calculated according to the following equation:
where F is fluxes (mmol m−2 d−1) across the water-air interface, Ct and C0 are the N2O concentrations in the chamber headspace at time t and 0, respectively (ppmv), Patm is the atmospheric pressure (Pa), V is the volume of the chamber headspace (m3), A is the chamber area in contact with water (m2), time is the time of the linear gas concentration increase (min), R is the universal gas constant (8.314 m 3 Pa mol−1 K−1), and T is the air temperature (K) during the measurement.
The kN2O estimation method used in this study is widely adopted in studies when both headspace equilibration and floating chamber methods are used together to assess gas velocity transfer of the gas emissions (Wu et al. 2021). FN2O was adopted to estimate the diffusive gas exchange velocity according to Fick’s law with the following equation:
where kN2O is the gas exchange velocity of N2O (m. d−1), FN2O is the N2O flux calculated from the floating chamber, KH is the Henry constant adjusted for the water temperature and salinity, dN2O water and dN2O air are the dissolved N2O concentration in the surface water and atmosphere, respectively.
2.4 Geographical analysis and Statistical analysis
Land use characteristics were identified using watershed delineation and data with a 10 m resolution provided by the European Space Agency (Zanaga et al. 2022). Circular upstream buffers with diameters of 100 m, 500 m, 1000 m, and 2000 m were extracted by ArcGIS Pro 10.4 software (ESRI Co., USA). Land cover was classified as water, forest, shrubland, grassland, and cropland (Fig. 1). The area of each land use within the buffers was retrieved and analyzed. Field observations revealed two contrasting landscape settings among the study sites. One group consisted of open, grass-dominated catchments with limited tree cover, whereas the other comprised catchments characterized by mixed vegetation, including forest, shrubland, and cropland. To facilitate comparison between these contrasting landscape types, sites were categorized as grassland areas when grassland represented more than 45% of the land cover, while non-grassland sites had lower grassland coverage (4 to 43%). This classification was used as an exploratory landscape grouping rather than a predefined ecological threshold. To determine spatial changes in the environmental factors, nutrients, and greenhouse gases, a Mann-Whitney U test was used. Spearman multiple correlation analyses were carried out between environmental factors and N2O concentrations and fluxes, since most of the variables did not present a normal distribution (Shapiro-Wilk normality test, p < 0.05). Principal component analysis (PCA) was conducted on key physiological variables (DO, NO3-, NH4+, DOC, water temperature, flow velocity, TP, and depth) to explore environmental gradients across the study sites.
3. Results
3.1 Patterns of riverine dissolved N2O concentration and fluxes
The average N2O concentration ranged from 7.76 to 47.6 nmol L-1 (mean was 31.3 ± 15.7 nmol L-1). The atmospheric N2O concentration was 328 ppb, equivalent to 13.4 nmol L-1. A moderate variability was observed with a coefficient of variation equal to 50%, but no clear spatial pattern was evident. N2O saturation ranged from 117 to 925%, with an average of 544 ± 252%, indicating intense oversaturation of N2O in the rivers and subsequent potential to emit to the atmosphere. The N2O flux spanned two orders of magnitude (24.53 to 638.94 µmol m-2 d-1) with an average of 177.02 µmol m-2 d-1.
3.2 Variation of physicochemical properties
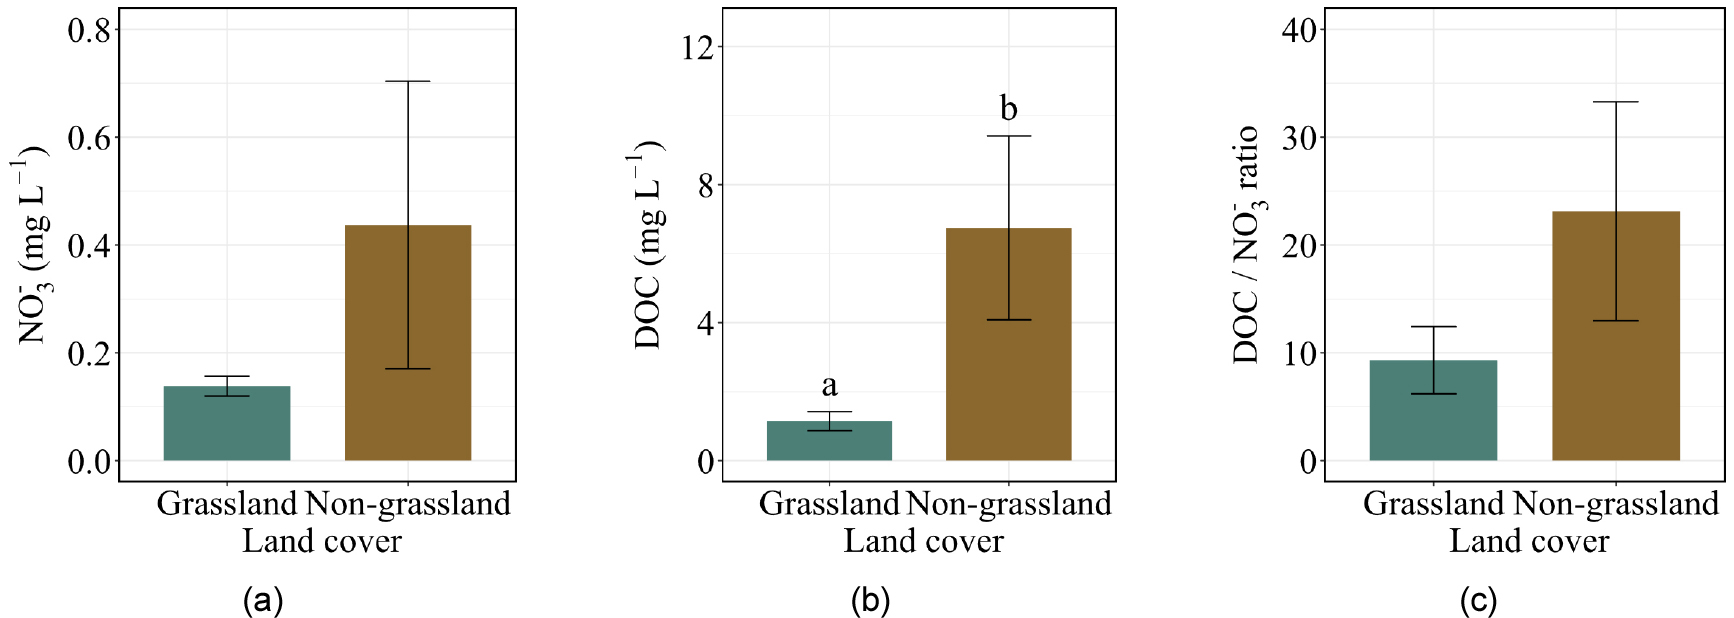
Physiochemical parameters were relatively consistent across the study sites, with several variables showing narrow ranges and moderate dispersion. Water temperature averaged 25.2 ± 2.5°C, while DO was 51.2 ± 14.2%. Electrical conductivity (EC) averaged 81.4 ± 22.6 µS cm⁻1, and TP concentrations were low, with a mean of 0.048 ± 0.012 mg L⁻1. Nitrogen species were generally low, NO3- averaging 0.27 ± 0.31 mg L-1 (Fig. 2 (a)) and NH4+ 0.15 ± 0.06 mg L-1. TN concentrations were also low (0.17 ± 0.16 mg L-1). DOC averaged 3.53 ± 4.03 mg L-1, while the DOC: NO3- ratio was 15.2 ± 13.3 (Figs. 2 (b) and (c)). The estimated gas transfer velocity (k) calculated from velocity and slope measurements ranged from 0.06 to 4.53 m d-1 with a mean value of 2.01 ± 1.29 m d-1.
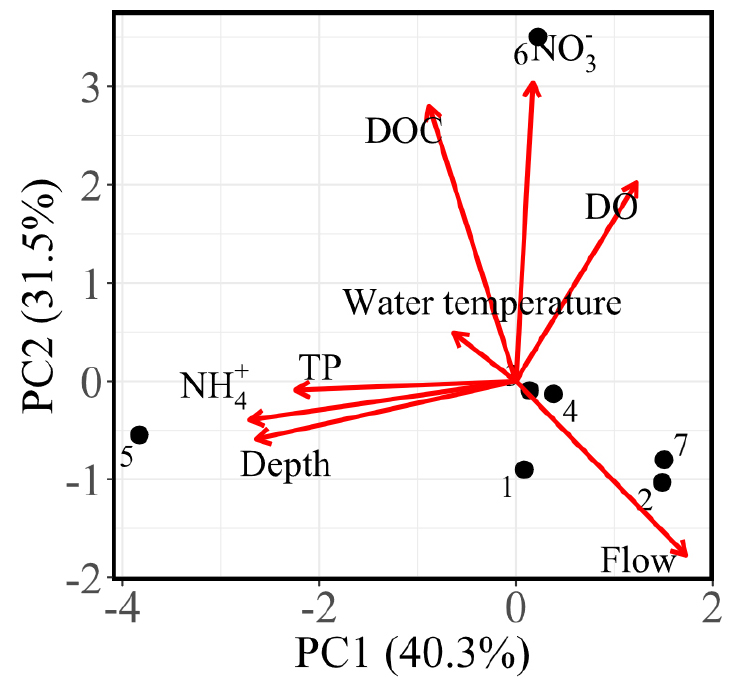
PCA was conducted on key physicochemical variables; the first two principal components explained 71.3% of total variance, with the first principal component and second principal component accounting for 40.3% and 31.5%, respectively (Fig. 3). The first principal component represented a gradient contrasting sites characterized by higher ammonium concentrations and depth with those with higher flow velocities. The second principal component was primarily associated with NO3-, DOC, and DO. The PCA biplot revealed that NO3- and DOC were positively correlated, as indicated by their similar vector orientations, whereas NH4+ and TP were negatively associated with these variables. Flow velocity was largely independent of nutrient-related variables. Sampling sites were widely dispersed in ordination space and did not form distinct clusters according to land cover classification, indicating that local environmental conditions varied independently of broad land-use categories.
3.3 Influence of land cover and physicochemical controls on N2O
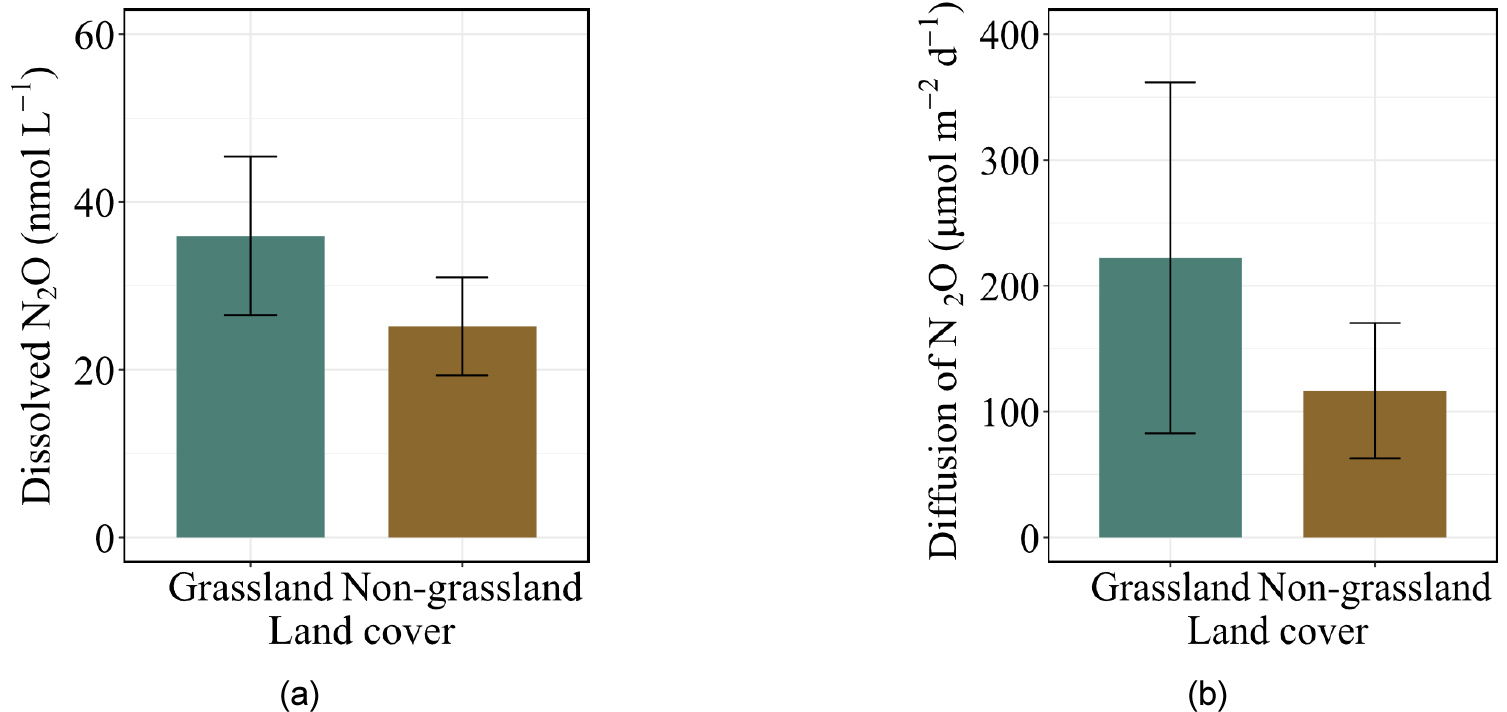
Grassland-draining river presented a numerically higher dissolved N2O concentration (35.96 nmol L-1) than non-grassland-draining rivers (25.17 nmol L-1), but the difference was not statistically significant (Fig. 4 (a)). Diffusive N2O flux did not differ significantly between grassland and non-grassland rivers (Fig. 4 (b)). Among physicochemical properties, grassland and non-grassland rivers exhibited a significant difference in EC, and DOC was statistically higher in non- grassland rivers. Although the mean NO3- presented a difference, it was not statistically significant. Despite these variabilities, no significant differences in remaining physicochemical properties were detected between land cover types.
No significant correlations were found between N2O concentrations and the key parameters. In particular, N2O showed no relationship with NO3-, and weak, non-significant relationships with NH4+ (r = 0.29, p = 0.56) and DOC (r = −0.39, p = 0.40).
4. Discussion
4.1 Patterns of riverine dissolved N2O concentration and fluxes
The dissolved N2O concentration in this study falls within the range reported for global river networks spanning from 2.86 to 1,335.71 nmol L-1 (mean value of 54.64 nmol L-1) (Wang et al. 2022), but exceeded the average concentration observed in tropical rivers (23.2 nmol L-1). Furthermore, the diffusive N2O fluxes were comparable to the global headwater stream emissions (109.06 ± 10.91 μmol m–2 d–1), but were a higher than reported for other tropical headwater streams (43.62 ± 16.36 μmol m–2 d–1) (Li et al. 2021). Diffusive N2O fluxes exceeded the values reported for rivers draining natural (10.96 μmol m–2 d–1) and agricultural (15.6 μmol m–2 d–1) land cover (Ho et al. 2020). These elevated fluxes suggest Ikopa tropical streams may represent an important yet poorly quantified source of N2O, highlighting the potential contribution of tropical African riverine systems to the regional greenhouse gas emissions
Despite relatively limited anthropogenic disturbance in some sites, the elevated diffusive N2O fluxes indicate active nitrogen transformation processes and efficient gas transfer dynamics. No significant difference in dissolved N2O concentrations and fluxes was detected between grassland and non-grassland rivers. This likely reflects the mixed land-use mosaic surrounding most catchments, where grassland-dominated sites often still contained a large proportion of cropland coverage and non-grassland sites were similarly heterogeneous (Fig. 1). Consequently, land cover categorizations may not adequately capture the hydrological, biogeochemical, and microbial controls governing N2O dynamics. Future studies incorporating finer-scale land cover characterization (e.g. proportion of land cover within the riparian zones) may help better resolve land cover influences on riverine N2O dynamics
4.2 Weak relationship between N2O and physiochemical variables
Riverine N2O production is governed by multiple interacting microbial pathways, including nitrification and denitrification, which may respond differently to oxygen variability, nutrient concentrations, and carbon inputs (Borges et al. 2018). In the present study, dissolved N2O concentration and fluxes were not significantly correlated with the measured dissolved nitrogen species, DOC, DO, or water temperature. Rather than indicating the absence of environmental control, these results indicate that N2O dynamics were influenced by multiple interacting processes operating simultaneously across sites. The limited sample size and strong spatial heterogeneity may also have reduced the ability to detect simple linear relationships.
The principal component analysis suggests contrasting hydrological and nutrient processing environments. The first principal component indicates a gradient between nutrient-retentive and hydrological dynamics. Increased turbulence and flow velocity enhance gas transfer efficiency, potentially promoting elevated N2O emission independently of dissolved N2O concentrations (Mwanake et al. 2019). Our results suggest that variability in N2O emissions was more influenced by turbulence-driven gas transfer. This may explain why high fluxes were observed despite the weak relationships with measured environmental variables and N2O concentrations.
Nitrification was likely not strongly nitrogen- limited, as indicated by the absence of correlation between N2O and NH4+. In this study, NH4+ concentrations exceeded those previously reported in agricultural tropical streams (NH4+= 0.04 mg L-1) (Masese et al. 2017). In contrast, mean NO3- concentrations in this study were lower than those stated in tropical rivers (1.44 mg L-1) (Mwanake et al. 2019), suggesting that elevated N2O concentrations in the studied rivers are unlikely to be explained solely by high inorganic nitrogen loading. These findings indicate that internal nitrogen cycling processes may play a more important role than external nutrient enrichment in regulating N2O production in these Ikopa rivers.
One plausible explanation is the elevated DOC: NO3- ratio across sites, which may favor heterotrophic microbial activity. When DOC: NO3- ratios are high, microbial communities may experience relative nitrogen limitation, potentially enhancing the rapid assimilation of NO3- and promoting denitrification-related pathways under localized redox conditions gradients (Taylor and Townsend 2010). Although direct denitrification process measurements were not conducted, the combination of low NO3- concentration, elevated DOC: NO3- ratios, and N2O supersaturation suggests that internal microbial nitrogen cycling, rather than external NO3- enrichment, may contribute to N2O production. This interpretation is further supported by the second principal component, which was associated with NO3-, DOC, and DO, indicating a gradient linked to oxidized nitrogen and organic matter dynamics.
4.3 Implications and limitations
A limitation of the present study is that each site was sampled only once, representing a spatial snapshot of riverine N2O dynamics at the onset of the wet season. The dataset does not capture temporal variability associated with seasonal changes, rainfall events, or fluctuations in river discharge, all of which may influence N2O production and emissions. Although the present study was based on a limited number of sampling sites, it highlights the substantial spatial heterogeneity of N2O dynamics in tropical rivers. The absence of a strong statistical relationship between N2O dynamics and observed environmental variables can be induced by the relatively small number of sampling sited and emphasizes the need for future studies incorporating more extensive spatial coverage, seasonal sampling, and direct measurement of microbial nitrogen transformation processes. The statistical analyses should be interpreted as explanatory and intended to identify potential environmental controls. Nevertheless, by quantifying N2O fluxes from streams in Madagascar, this study provides the critical baseline data that helps reduce uncertainties in African N2O budgets and suggests that localized environmental conditions may outweigh broad land-cover effects in regulating tropical river greenhouse gas emissions.
5. Conclusion
Ikopa tropical rivers were consistently supersaturated with a source of N2O, with concentrations and fluxes exceeding those typically reported for tropical rivers highlighting their potential contribution to regional greenhouse gas emissions. Despite the absence of significant relationships between N2O dynamics and physiochemical variables, multivariate analyses revealed contrasting hydrological and nutrient-processing environments among sites. The elevated N2O concentrations and emissions observed in this study are unlikely to be explained solely by inorganic nitrogen enrichment. The combined influence of hydrological exchange, turbulence-driven gas transfer, and localized microbial pathways likely regulates N2O production and emissions in these tropical rivers. This study contributes to reducing uncertainties on riverine N2O emissions in Madagascar by providing first baseline measurements of riverine N2O concentrations and fluxes. Future studies integrating seasonal monitoring and direct process measurements, and finer- scale land cover characterization will be essential to better constrain the mechanisms controlling N2O production and emissions in tropical African rivers.