

1. Introduction
2. Materials and Methods
2.1 Study Area and Monitoring Data
2.2 Sampling Sites and Fish Collection
2.3 Analysis of Data using the Index of Biological Integrity (IBI)
2.4 Analysis of Qualitative Habitat Evaluation Index (QHEI)
2.5 Evaluation of Habitat Suitability Index (HSI)
2.6 Estimation of Optimal Ecological Flowrate (OEF)
3. Results and Discussion
3.1 Fish Assemblages Analysis
3.2 IBI and QHEI Values
3.3 Habitat Model
4. Conclusion
1. Introduction
In developed countries, the modern goal of water policy is not only to preserve ecosystems, but also to rehabilitate them and restore their functions. However, since 1980s, rapidly increasing urban developments, industrial complexes, and population growth in Korea has caused degraded stream water and ecological disturbances. This, in turn, has resulted in a decrease in the diversity of freshwater fish (Lee 2001).
Although hydropower has its own merits in that it’s a so-called clean, renewable source of energy, along with current trends in pursuit of low-carbon emissions, it has direct and indirect impacts on river environment and fish habitats in terms of ecology (Scruton et al. 2008). Outflow released from a dam, for example, to produce electricity (“dam outflow”) may directly reduce or endanger specific fish downstream of a river (Scruton et al. 2008). When it comes to its indirect impacts, fish may move to another habitat, or benthic organisms serving as food for their predators may be exposed to a decrease or extinction, while some parts in a river get dried or wet depending on outflow (Cereghino and Lavandier 1998). In addition, as part of the polluted rivers and urban development, various eco-friendly river rehabilitation projects are carried out to improve the aquatic ecosystem health and habitat area. Physical habitat simulations have been used to investigate the environmental changes effects on aquatic habitats. Examples include the river restoration (Booker and Dunbar 2004, Moir et al. 2005, Im et al. 2018), the estimation of environmental flows (Moir et al. 2005, Im et al. 2018), and the impact of hydraulic structures (Choi and Choi 2018, Kang and Choi 2018). In addition, there have been studies that address the impacts of dam outflow for electric generation on habitats for salmonids or other benthic organisms (Saltveit et al. 2001). Most of them, however, focused on a change in fish community and diversity. There is also a study that simulated weighted usable area (WUA) for the habitation of fish according to the volume of dam outflow (Saltveit et al. 2001). In spite of that, sufficient studies on the simulation of fish habitats haven’t been carried out.
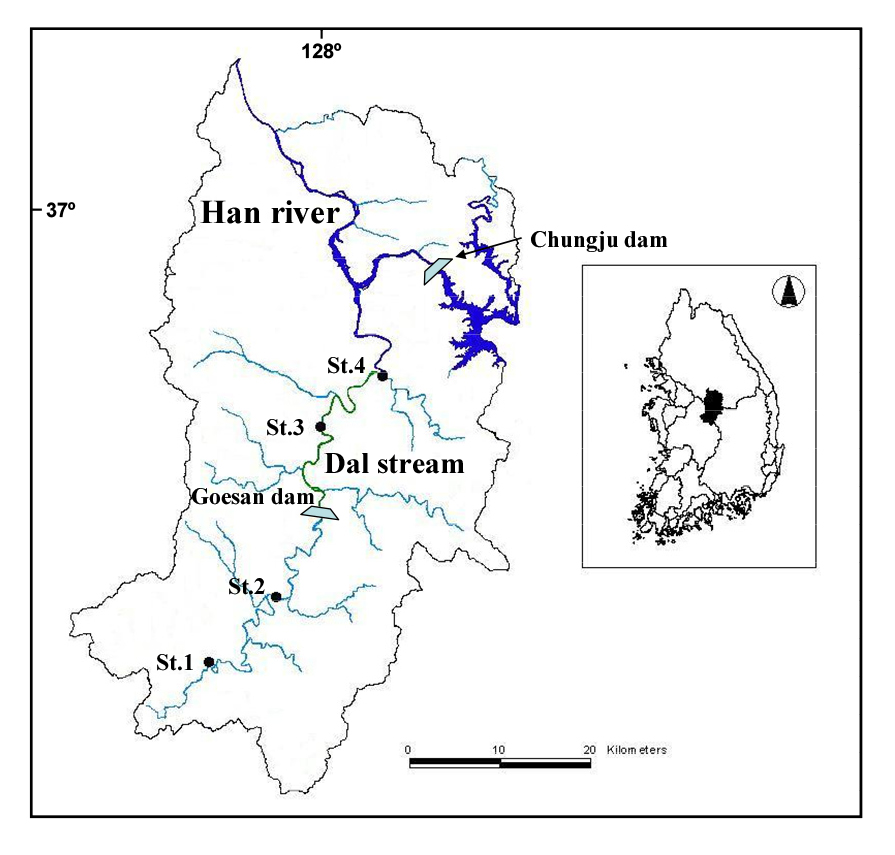
There is a dam (i.e. Goesan Dam) midstream of the Dal Stream addressed in this study. The dam releases outflow to generate electricity. This outflow has direct impacts on the area vertically downstream of the stream; the area gets submerged while the dam releases outflow, but it gets dried in many parts while not. In this study, accordingly, two monitoring sites upstream of the Goesan Dam and two monitoring sites downstream of the same dam were selected. Fish sampling was monthly carried out at the four monitoring sites over one year. In April and October, stream cross section and bed substrates were measured. Based on the consequent findings, fish habitat suitability index (HSI) was estimated. And optimal ecological flow was simulated using PHABSIM.
2. Materials and Methods
2.1 Study Area and Monitoring Data
The Dal Stream is located in the central part of Korea. It is one of tributaries from the Han River. It occupies an area of 1,614.4 km2, extending up to about 123 km from the south to the north. There is one small-scale dam in the Dal Stream, called the “Goesan Hydropower Dam” constructed in April, 1957.
In the stream, drought flow and design flood amounts to 1.8 m3/s and 1,750 m3/s, respectively. The dam releases up to 1,160 m3/s of outflow (July 25, 2008), but 5 to 20 m3/s at ordinary times. Inflow from upstream (in the dam) amounts were to 1 to 10 m3/s (February to May, 2008), when dam outflow (for electric generation) was 7 to 18 m3/s.
2.2 Sampling Sites and Fish Collection
Monitoring was conducted for ecological and habitat conditions for 4 sites (St.1: N 127° 40′38″ E 36° 35′5″, St.2: N 127° 45′51″ E 36° 38′20″, St.3: N 127° 45′37″ E 36° 40′21″, St.4: N 127° 48′40″ E 36° 43′39″). In the present study reach, for the 2007 - 2010 periods, hydrologic data and monitoring data were collected through government R&D projects. The monitoring data include date, water depth, velocity, substrate, water temperature, concentration of suspended solid, pH, and population of the individual fish species. After selecting the sampling sites, fish sampling was conducted at 4 sites of the river during September 2008 – September 2009 and followed the wading method suggested by Ohio EPA (1987). Each sampling site is as follows (Fig. 1).
Fish were captured using a cast net (mesh size: 6×6 mm) and a kick net (3×3 mm) due to the sampling efficiency of sentinel species and applicability on the sampling sites. For community assessment, fish collections were conducted according to the method of the catch per unit of effort. All habitat types including riffle, run, and pool were sampled in the upstream and downstream directions for a distance of at least 150 - 200 m during 60 - 70 min per site.
Collected specimens were preserved in 10% formalin solution until counting, after which they were stored in 5% formalin solution. All specimens were identified according to Choi and Choi (1990) and Kim and Park (2002), based on the classification system of Nelson (1994). Scientific names and authorities follow those of Kim and Park (2002).
2.3 Analysis of Data using the Index of Biological Integrity (IBI)
A metric system of 10 was adapted in Growth Rates (GR) for the IBI, instead of the 12 metrics suggested by Karr et al. (1986), due to difficulties in evaluating the metric of long-lived fish and top carnivores. Attributes of the following four metrics among 10 original metrics suggested by Karr et al. (1986) were modified and substituted for regional application: native species richness, benthic species richness, water column species richness, % nonnative individuals (US Environmental Protection Agency, 1993). Tolerance designation, trophic status, and origin of collected fish species were classified based on the previous studies of Kim (1997). Each metric received a score of 1, 3 and 5, with 1 being the worst and 5 being the best possible of each individual metric.
Scoring criteria for each metric were based on the maximum species-richness line, which was developed by Rankin and Yoder (1999). The sum of those scores (5, 3, and 1) provides an IBI value at each site of GR. The integrity class suggested by Karr (1981) was modified and then assessed for each site. The highest score was 50 which indicate undisturbed conditions, and the lowest score was 10 which indicate very poor conditions for the fish communities. Thus, the sampling sites were assigned into five integrity classes of excellent (48 - 50), good (38 - 42), fair (30 - 34), poor (18 - 24), or very poor (3 - 12) conditions. The 10 metrics were composed of three major groups: species richness and composition, trophic composition, and fish abundance and health condition.
2.4 Analysis of Qualitative Habitat Evaluation Index (QHEI)
Stream habitat data were also extracted from the statewide database as the QHEI. We selected ten habitat parameters for the assessment of QHEI, based on the widely used references (US Environmental Protection Agency, 1983a, 1983b). The QHEI is a qualitative assessment of major features of stream habitats that influence the potential for healthy fish communities (Rankin 1989, Gordon et al. 1993). Each parameter was divided into four categories of optimal, sub-optimal, marginal and poor conditions, based on the criteria of US EPA (US Environmental Protection Agency, 1983a, 1983b). The health conditions of the habitat were assessed by sum of scores obtained from the seven parameters and were categorized as four levels of excellent (>162), good (148 - 104), fair (90 - 46) and poor (<32) conditions.
2.5 Evaluation of Habitat Suitability Index (HSI)
The HSI model evaluates physical habitat suitability in each cell within the study area based on the observed organism population and environmental factors. The model consists of aggregated HSI which range from zero (not suitable) to one (most suitable) for an organism. The field observation data were used to obtain HSI in the study area. The frequency (number of monitored population) distributions were calculated by dividing each frequency by the maximum frequency, which normalized the values to the zero-one HSI range. The condition with the highest frequency was identified as the most suitable conditions for fish habitat. Based on the monitoring data of velocity, depth and substrate size, OEF were estimated using the HSI established for Z. koreanus, P. tungia herzi, C. splendidus, and Z. platypus selected as icon species using the PHABSIM.
2.6 Estimation of Optimal Ecological Flowrate (OEF)
The PHABSIM has been applied to estimate the optimum flow of fish habitat for each representative reach. The determination of optimum flow regime for fish habitat was performed by the estimation of optimum flow using a relation curve between the WUA versus discharge obtained by the combination of the hydraulic model and the HSI.
The optimum flow regime suitable for fish habitat can be determined by performing hydraulic modeling. In this case, the WUA can be estimated by the multiplication of cell size of the reach and a combined HSI using Eq.1. The WUA is an area indicating overall habitat quality at a particular.
where, Ai is an area of cell i and Ci = combined HSI of cell i.
Palmer and Snyder (1985) estimated the combined HSI, Ci by the combination of the suitability criteria of depth, velocity and substrate size, and determined by the standard computation, geometric mean method and minimum value method. In this study, the standard computation shown in Eq. 2 was employed (Rankin 1995).
where, vi is HSI of cell i regarding velocity, di is HSI of cell i regarding depth of flow and ci is HSI of cell i regarding substrate size.
3. Results and Discussion
3.1 Fish Assemblages Analysis
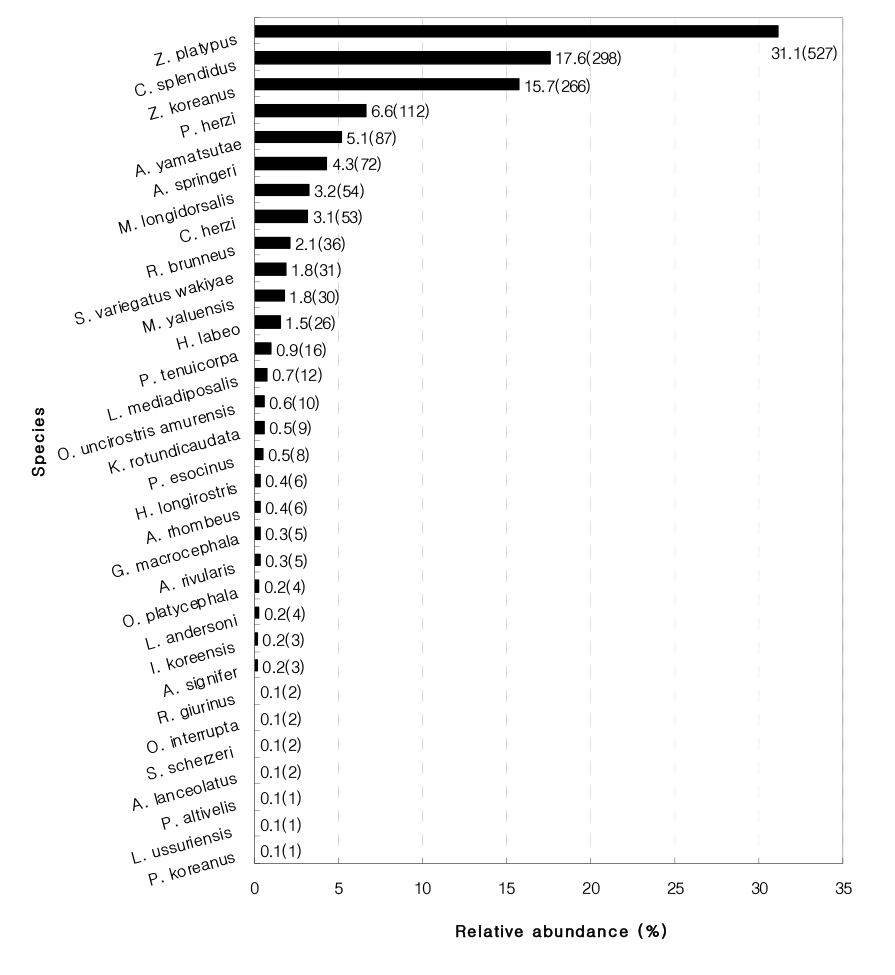
Fish sampled in the Dal Stream totaled up to 1,807 individuals with 33 species under 8 families (Fig. 2). Of these species, 19 species corresponding to Family Cyprinidae, most dominantly, occupied as high as 57.6%. Their dominance over other species is typical of freshwater fish that inhabits streams in Korea that flow from West Sea to South Sea (Jeon 1980).
Of those captured species, ones endemic to Korea totaled up to as many as 18 species (54.5%), including Acheilognathus yamatsutae, C. splendidus, Z. koreanus, C. herzi, etc. It was reported that endemic species were prevalent in a healthy and sound stream with good water quality and various bed substrates (Choi and Byeon 2009). Originating from Mt. Sokri, the Dal Stream is confluent with the Han River. Channels it flows through are surrounded by the high mountain and free of pollutants. This is why it’s well conditioned for the habitation of endemic species.
Endangered species captured in this study include Acheilognathus signifer, Pseudopungtungia tenuicorpa, and Gobiobotia macrocephala. They are distributed over the tributaries of the Han River and the Imjin River. But civil works currently implemented, and consequently, water pollution have caused disturbances to ecological systems in their habitats. This, in turn, resulted in a decrease in their population, so that they are currently under legal protection (Kim et al. 2005). Accordingly, a prudent study, for example, on their ecological niche and physical habitats are required. There were neither species designated as natural monuments nor exotic species in the captured species.
Highly prevalent captured species include Z. platypus (30.4%, 550 individuals), C. splendidus (18.1%, 327 individuals), Z. koreanus (15.1%, 272 individuals), P. herzi (6.5%, 117 individuals) and A. yamatsutae (5.8%, 104 individuals).
3.2 IBI and QHEI Values
IBI values tended to decrease from upstream to downstream (Fig. 3). But it’s general that fish species captured increase from upstream to downstream since stream order increases. Accordingly, it’s judged that this tendency results from the rarity of endemic species and the high prevalence of other species that might have negative impacts on IBI values. On the other hand, all monitoring sites showed, at least, good results in terms of QHEI values. It’s judged that a river rehabilitation project has positive impacts on QHEI values.
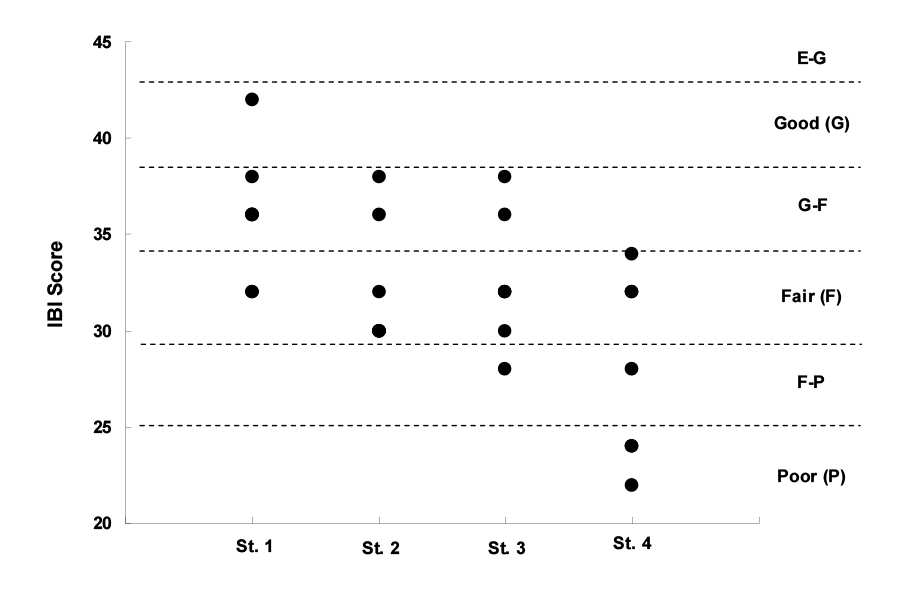
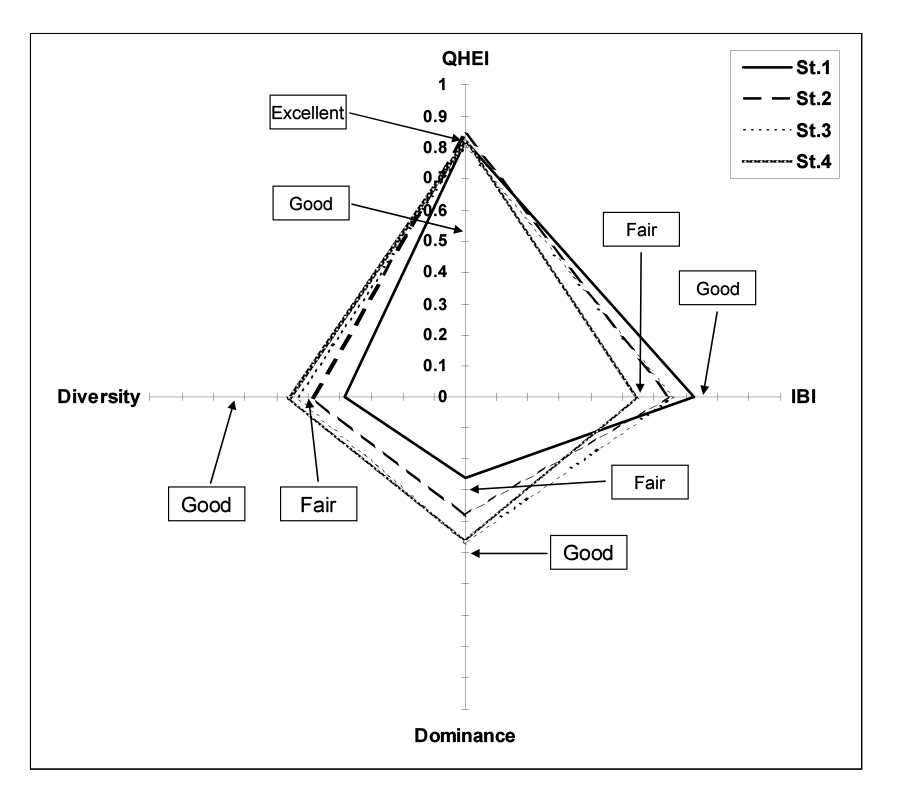
Fig. 4 shows the correlations of biological indicators (e.g. IBI, Diversity, Dominance, etc.) with QHEI. As mentioned above, all monitoring points were in good status in terms of QHEI, one of physical indicators, due to a river rehabilitation project. However they were found to be in a fair status in terms of biological indicators. The IBI shows that the upstream is larger than the downstream from the dam, which is consistent with the previous results Fig. 4. However, Diversity and Dominance have the contrast results. This is because that the river rehabilitation project was carried out downstream from the dam. However, the Diversity is not high due to the influence of the dam.
3.3 Habitat Model
Based on such factors as dominant species, endemic species and habitat behaviors at each monitoring sites (Sites 1 to 4), Z. koreanus (St. 1), P. herzi (St. 2), C. splendidus, (St. 3) and Z. platypus (St. 4) were selected as representative species at the same sites (Table 1). Their life stages were classified using findings in this study and other references; life stages used in this study were found to be similar to the corresponding ones as shown in other fish guides or studies in terms of stage classification [1,10,12,16,25]. And then, HSI was estimated in terms of flow velocity, water depth and bed substrates based on the classified life stages (“velocity HSI,” “depth HSI” and “substrate HSI”).
Table 1.
Life stages of HSI in terms of velocity, depth and substrate size
At Site 1, velocity HSI for Z. platypus was estimated at 0.4 to 0.6 m/sec during the spawning season (May to August) and 0 to 0.4 m/sec during the juvenile season (September to November). Their depth HSI was estimated at 0.3 to 0.6 m during the spawning season and 0.4 to 0.6 m during the juvenile season, with their substrate HSI at 4 to 6 during all seasons. At Site 2, velocity and depth HSI for P. herzi during the spawning season were estimated at 0.2 to 0.4 m/s and 0.3 to 0.5 m, respectively. At Site 4, velocity and depth HSI for Z. platypus during the juvenile season were estimated at 0.3 to 0.4m/s and 0.3 to 0.6m, respectively. The range of the estimated flow velocity and water depth was larger during the spawning season than during the juvenile season. It’s judged that this results from seasonal factors and size of captured fish; juveniles prefer a shallow and slow reach to a deep and fast one for their habitats (Hur and Seo 2011).
Fig. 5 shows WUA-flow relations for the representative species at each monitoring site using PHABSIM. In the figure, it can be seen that WUA values decrease from upstream to downstream. This results from an increase in channel width and flow due to the confluence of different streams going downstream. It was also found that there were differences in WUA according to life stages at each monitoring site. Although there are somewhat variations among them, those representative species generally go through the spawning season (between Spring and Summer) followed by the juvenile season (1 to 2 months after that spawning season).
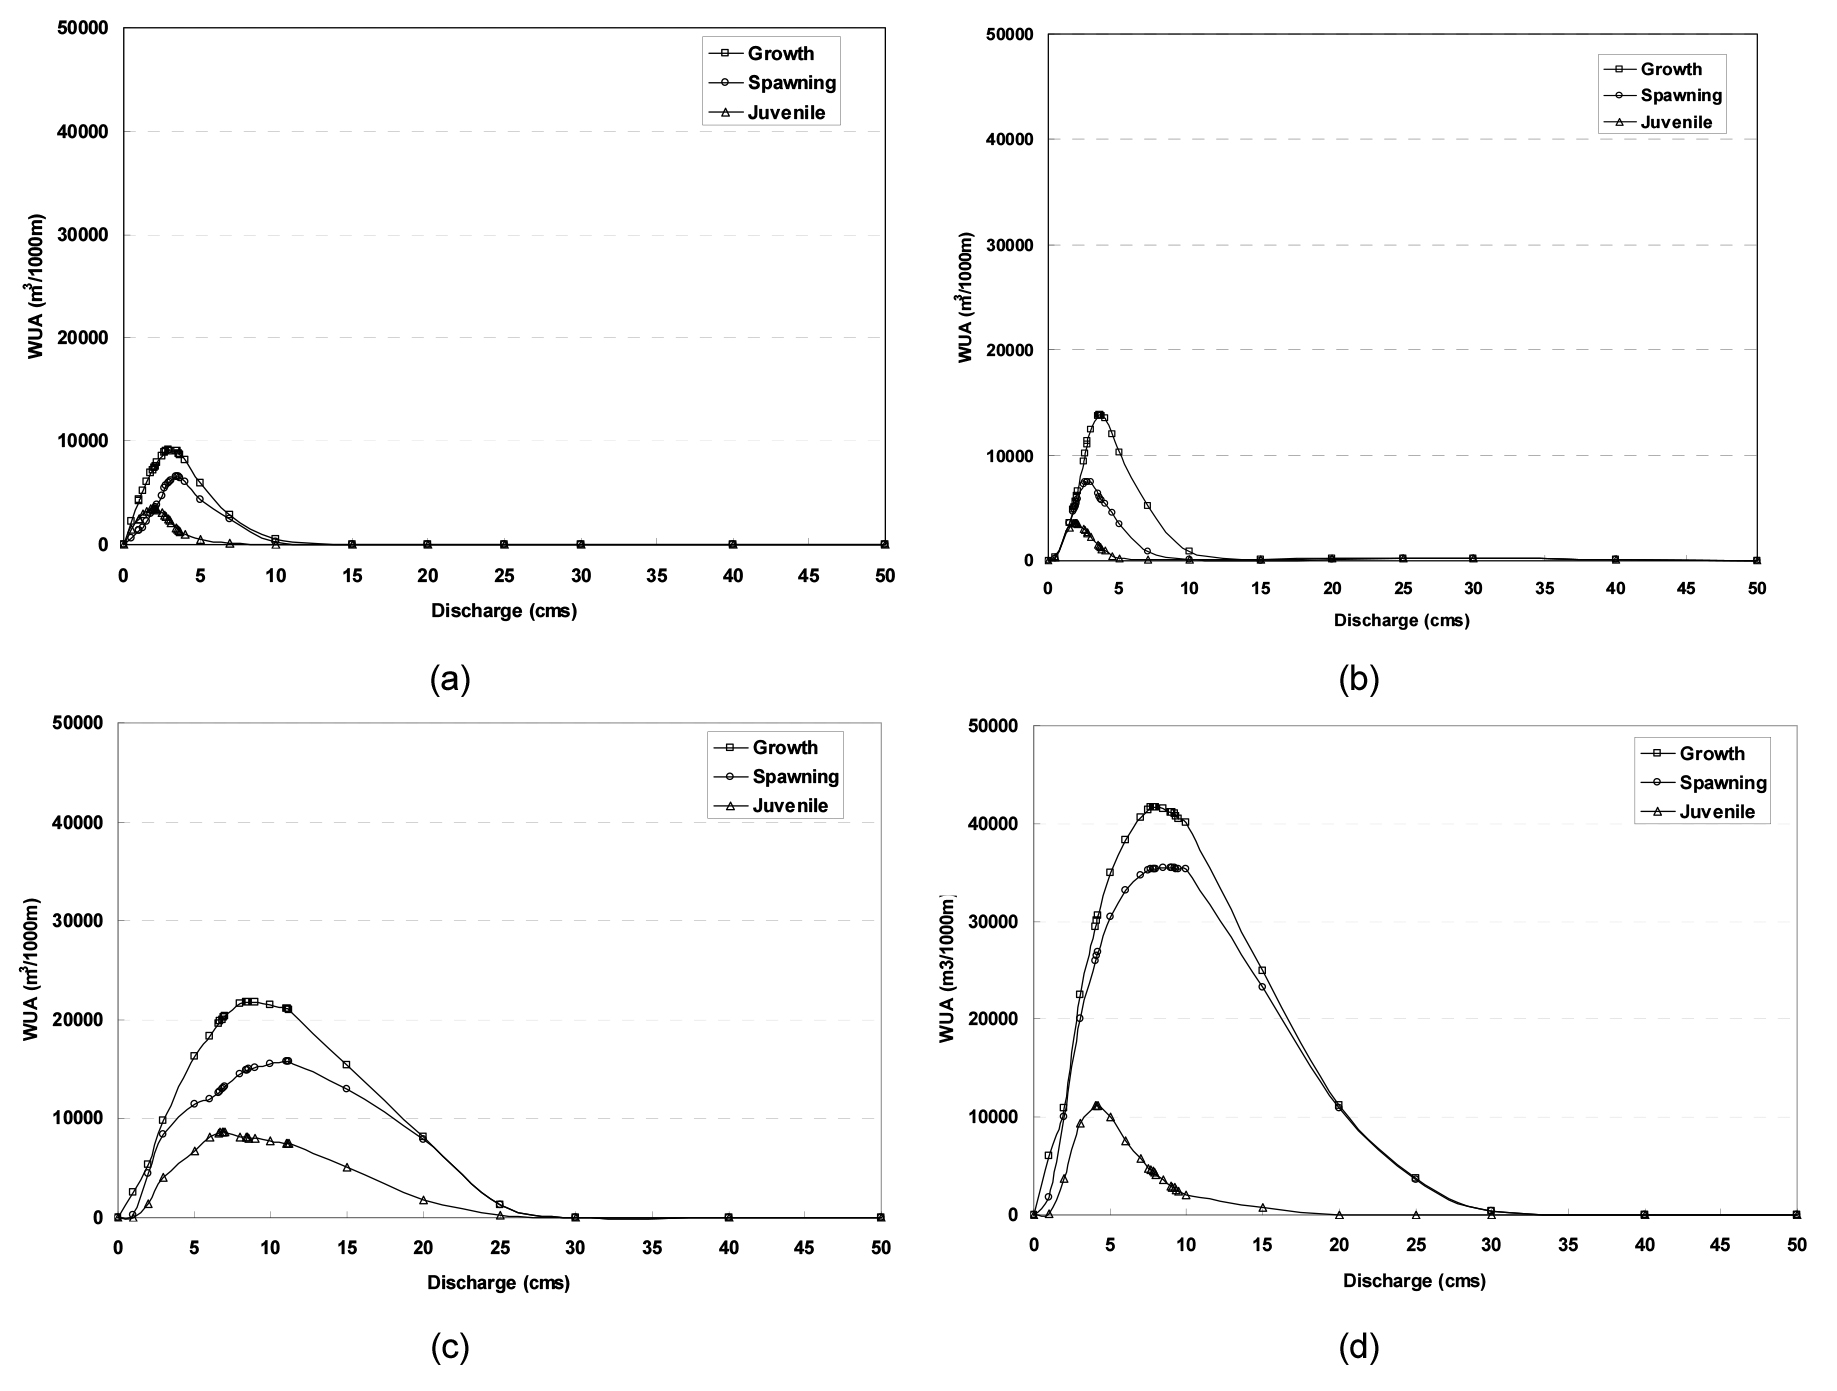
Accordingly, they spawn around June that falls under the rainy season in Korea. This is why WUA values are somewhat larger during the spawning season than during the juvenile season. In addition, the latter season is a season when juveniles inhabit the right and left bank with water plants because of an increase in channel flow. It’s judged that this is because the place is where a channel flows shallow and slow; that is, the range of HIS values is narrow.
Hur and Kim (2009) and Lee et al. (2012) reported that habitats for juveniles were widely distributed at the right and left bank in a channel (i.e. edge of a channel), and that this place provides not only favorable conditions for their habitation but also shelters to escape from their predators. Moreover, annual and perennial plants growing at such bank or in close and open pools serve as optimal habitats for hatched juveniles. In this study, samples captured in September contained a small size of juveniles that inhabited the right and left bank or pools.
4. Conclusion
This study attempted to estimate ecological flow required to assess riverine healthiness and maintain ecosystems by identifying the properties of habitats by fish species (monitored at the four sites in the Dal Stream, one of tributaries from the Han River) and building database for the results. Based on such on-site monitoring results, fish fauna, bio-diversity, riverine healthiness and soundness, HSI, IBI, etc. were analyzed. And optimal ecological flow was estimated using PHABSIM. The following shows the summarized results of this study:
1) Fish sampled at the four monitoring sites totaled up to 1,807 individuals with 33 species under 8 families, of which Z. platypus (31.3%) and C. splendidus (17.6%) were found to be dominant and subdominant, respectively. Also, three endangered species was captured.
2) All monitoring points were in good status in terms of QHEI, one of physical indicators, but they were found to be in a fair status in terms of IBI.
3) In WUA-flow relations for the representative species at each monitoring site using PHABSIM, it was found that WUA values decreased from upstream to downstream. This results from an increase in channel width and flow due to the confluence of different streams going downstream.
4) Uniquely in this study, HSI and PHABSIM were applied on a seasonal basis. It’s expected that the study will help with the future studies suitable for Korean fish habitats.
These results can be used as important data for supporting water management policy to manage water quality and aquatic ecosystem habitat as an integrated system. In addition, it is considered that it will be an important indicator to set the direction considering both quantity and aquatic ecology when the river rehabilitation project is carried out in the local government.
