


1. Introduction
2. Materials and Methods
2.1 Study Sites and ARUs Installation
2.2 Data Collection and Analysis
3. Results
3.1. Regional Comparison of Nocturnal Diel Peak Call Distributions: Northern versus Southern Regions
3.2. Comparison of Distribution of Peak Calls Among Cohabiting Anurans
4. Discussion
4.1. R. uenoi
4.2. R. huarenensis
4.3. B. orientalis
4.4. H. japonica
4.5. P. nigromaculatus
5. Conclusions
1. Introduction
Anuran amphibians are quintessential nocturnal creatures within natural ecosystems. After sunset, when the lack of sunlight allows for unobstructed cutaneous respiration, these animals primarily rely on vocalizations as a primary mode of communication within their species. In the Republic of Korea (hereafter Korea), common species such as the black-spotted pond frog (Pelophylax nigromaculatus), the Korean large brown frog (Rana uenoi), and the Japanese tree frog (Hyla japonica) use advertisement calls during their breeding seasons. These vocal signals serve to communicate with conspecifics and to assert territorial presence to potential competitors within their ecological niches. For humans, these vocalizations serve as an important tool for confirming species presence, estimating species abundance, and indirectly assessing habitat integrity (Ulloa et al. 2019).
Amphibians exhibit considerable global diversity; however, many species face the threat of extinction due to climate change, habitat alteration, and pathogenic factors (Grant et al. 2016, Luedtke et al. 2023). Despite this, biological and ecological data regarding their status remain comparatively limited (Edwards et al. 2023). Consequently, there is a pressing need to enhance and expand amphibian monitoring and survey programs worldwide (Young et al. 2001, Crouch et al. 2002, Collins and Halliday 2005, Weir et al. 2014). In the Republic of Korea, the National Institute of Ecology (NIE) has conducted the most comprehensive nationwide amphibian surveys as part of its National Ecosystem Survey Project. Since 2014, field researchers have monitored amphibian species diversity across up to 780 quadrats, each approximately 12 km by 12 km in size, on a five-year rotational basis (NEST 2025). This initiative constitutes the only nationwide biological and ecological survey program mandated by Korean legislation and is implemented annually under the supervision of the Korean Ministry of Climate, Energy, and Environment. Notably, among the eight taxonomic groups surveyed — flora, vegetation, herpetofauna, fishes, terrestrial insects, benthic macroinvertebrates, birds, and mammals — amphibians are the only group for which nocturnal surveys are obligatory.
However, the results may vary depending on the investigators’ experience, knowledge, and spatiotemporal preferences during the survey. In particular, a lack of familiarity with survey sites can increase the risks of experimental errors, such as conducting surveys when calling activity has diminished, misidentifying calls, or failing to detect calls despite the presence of species (Bridges et al. 2000, Corn et al. 2000, Lotz and Allen 2007, Brauer et al. 2016). To minimize inter-observer variation and maximize survey efficiency within the constraints of time and budget, it is essential to identify optimal periods of calling activity, thereby enabling field investigators to be informed in advance about appropriate survey times and habitats.
In addition to the investigator’s expertise, logistical constraints must be taken into account. Amphibian field surveys are generally conducted along predetermined routes within limited time frames, employing visual encounter surveys and auditory monitoring (Heyer et al. 2014, NEST 2025). Budgetary restrictions, a shortage of skilled personnel, and challenges related to site accessibility such as safety concerns — often impede the development of an optimal survey design. As a result, compromises between the number of survey sites and the duration allocated to each site are frequently necessary (Doracas et al. 2009). Although daytime surveys often enhanced visibility, the small body size, cryptic coloration, and nocturnal activity patterns of amphibians make their detection more challenging than that of other taxa.
Traditionally, the detection of species presence, communication, and sexual status has primarily depended on direct human auditory observation. However, advancements have significantly expanded methodological approaches (Martins et al. 2025). In this regard, Automated Recording Units (ARUs) offer a promising alternative to conventional survey methods by enabling the systematic collection of acoustic data. This technique is particularly advantageous for monitoring species that are challenging to observe visually (Balantic and Donovan, 2019, Bridges and Dorcas 2000). Anurans, including frogs and toads, are more reliably identified through their vocalizations than through visual observation (Heyer et al. 2014, Köhler et al. 2017). Given that each species produces distinctive vocal signatures, biological calls can be discriminated even amidst overlapping acoustic signals (Bridges and Dorcas 2000). ARUs facilitate the systematic acquisition of acoustic recordings at predetermined intervals with minimal human intervention, thereby supporting long-term monitoring efforts and mitigating the risk of under- or overestimating species richness commonly associated with short-term surveys (Peterson and Dorcas 1992, Blumstein et al. 2011). Moreover, ARUs provide critical data on the spatiotemporal patterns, intensity, frequency, and diel variation of calling behavior (phenology), which can inform the optimization of survey timing (Hall et al. 2025).
From an applied herpetological perspective, ARUs have facilitated the monitoring of the vocally active invasive American bullfrog (Lithobates catesbeianus) in South America and Europe, aiding in the identification of optimal observation periods and contributing to management and control strategies for this non-native species (Laufer et al. 2017, Bota et al. 2024). Autonomous recording has also proven valuable for tracking population dynamics in boreal frog species under changing climatic condition. Because anurans are ectothermic, ambient temperature serves as a predictor of calling activity with increased detections occurring at warmer temperatures (Pellet and Schmidt 2005). Long-term acoustic monitoring of wood frogs in subarctic forests has revealed shifts in breeding phenology correlated with temperature changes, suggesting that calling phenology is likely influenced by global climate change (Larsen et al. 2021). Recent research has focused on enhancing call detection probabilities by addressing heterogeneity in detection caused by spatiotemporal variation in vocalizations across species and the inherent complexity of acoustic data (e.g., Bobay et al. 2018, Hall et al. 2025). In this context, researchers have sought to optimize the number of ARUs deployed and to deepen the understanding of breeding behaviors to improve species detection rates. Additionally, automated classification software has been developed to facilitate species identification within large acoustic datasets (Speaker et al. 2021, Martins et al. 2025).
Although autonomous vocal recordings are employed globally, ecological research utilizing ARUs in Korea remains relatively nascent and limited in scope. Acoustic monitoring using ARUs represents a promising methodology for conducting surveys across extensive and diverse habitats, particularly when physical resources such as personnel and time are limited. This approach is especially advantageous for data collection during nocturnal periods. This study aimed to characterize the nocturnal calling behaviors of anuran species inhabiting forested valley ponds in Korea by analyzing peak vocalization data collected by ARUs throughout the breeding seasons. The findings of this research are intended to assist researchers in identifying optimal survey periods for anuran detection within forest ecosystems, thereby enhancing detection efficiency and contributing to a more comprehensive understanding of species distribution and behavioral ecology. To achieve this comprehensive objective, with a particular focus on temporal calling patterns and seasonality, the study addressed the following research questions: (1) How do peak calling activities of anuran species vary along environmental gradients, especially ambient air temperature? and (2) How do cohabiting species differ in their peak calling activities across environmental gradients, with specific attention to variations in air temperature?
2. Materials and Methods
2.1 Study Sites and ARUs Installation
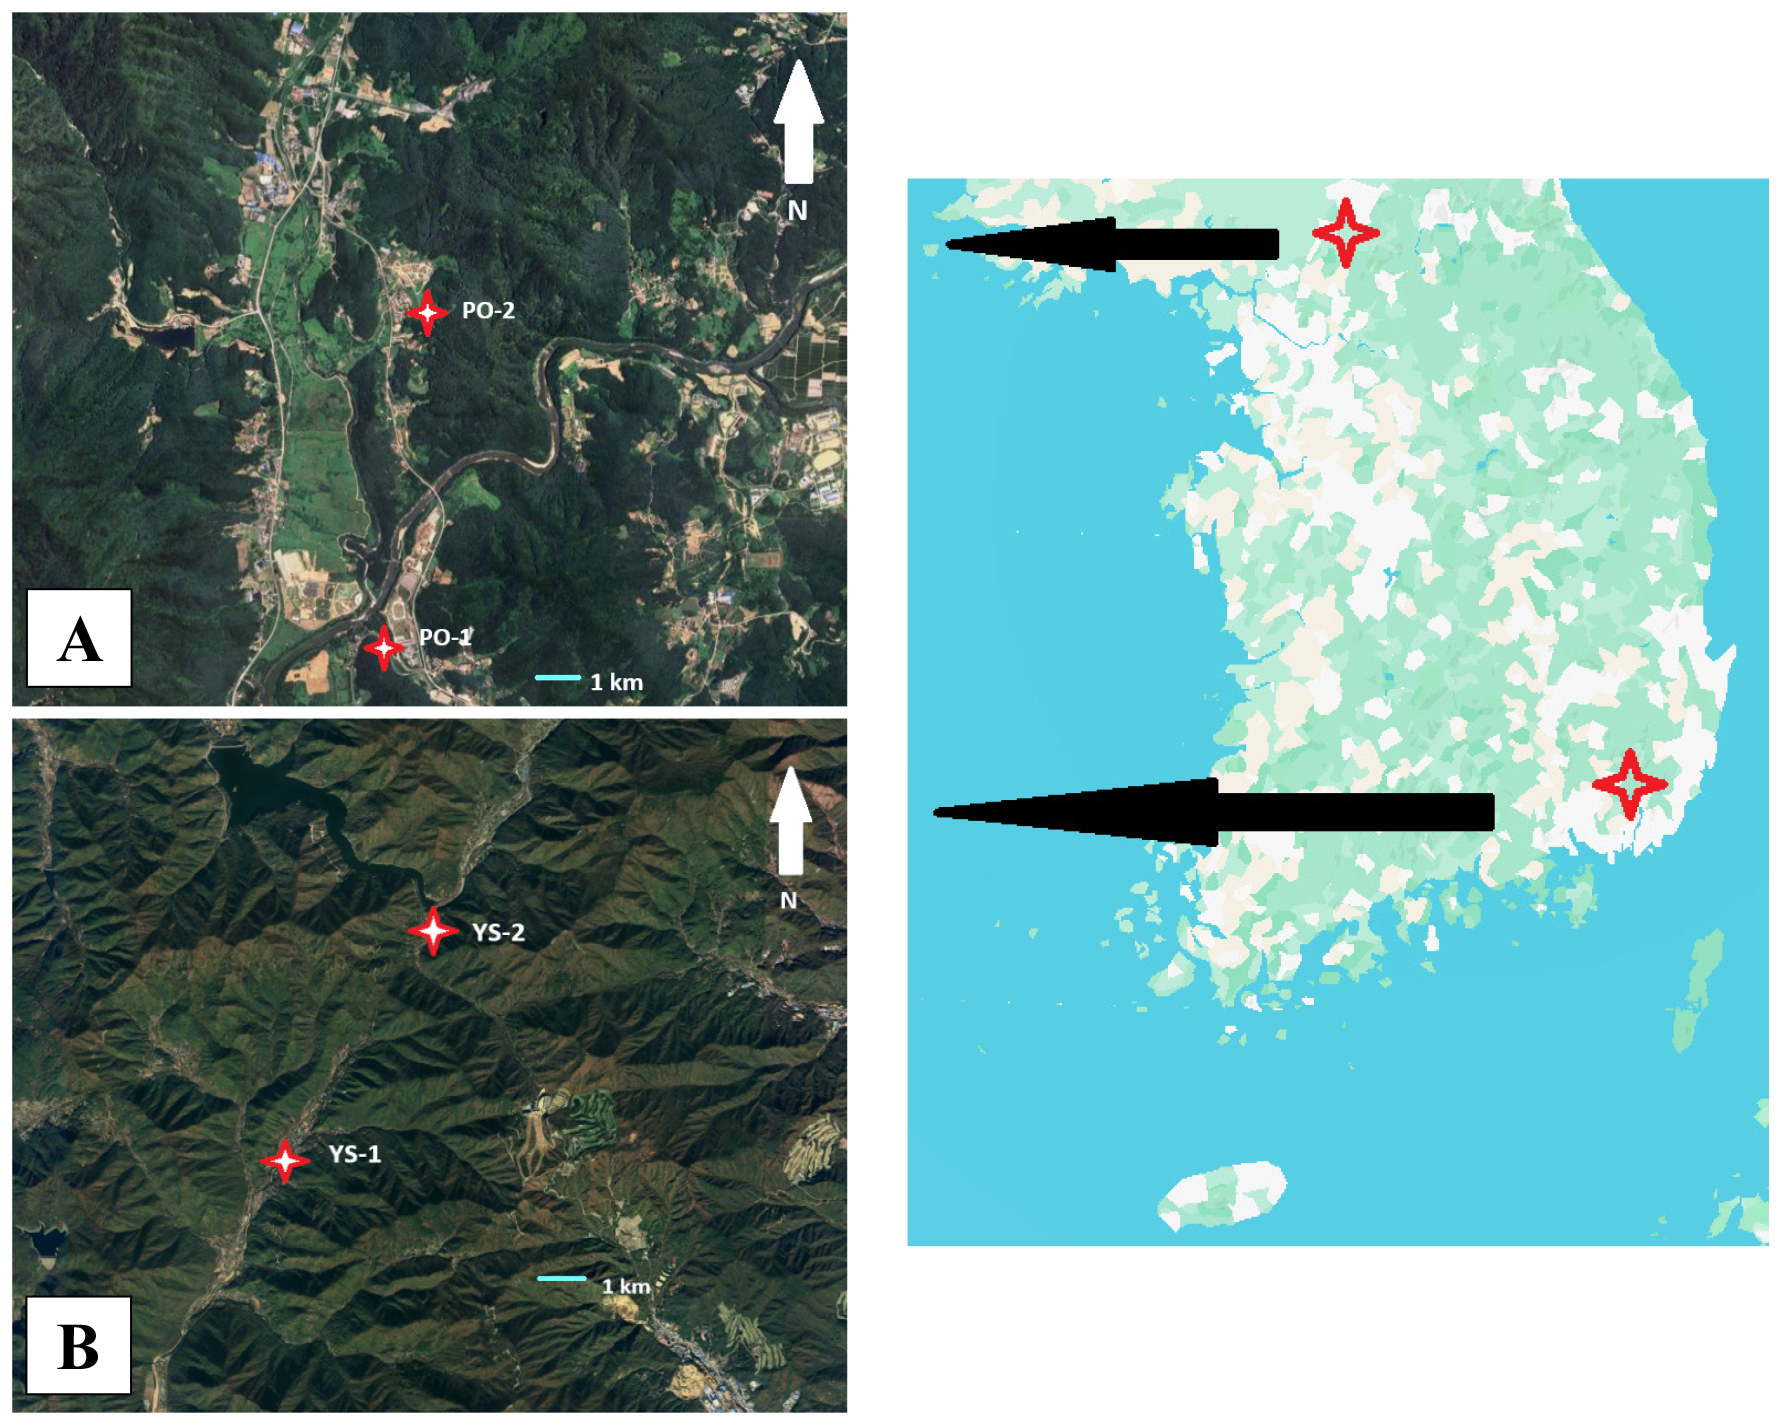
From early spring to mid-summer (March 14 to July 5), corresponding to the primary breeding and vocalization period of forest-dwelling frogs and toads in Korea (NIBR 2025), ARUs were deployed at four pond sites located within forested mountain valleys. The selected sites exhibited similar vegetation characteristics, predominantly comprising tree species such as Quercus acutissima, Quercus mongolica, Quercus variabilis, and Acer spp. (Fig. 1). The two northern sites, PO-1 and PO-2, situated in Pocheon, Gyeonggi Province, were located at 38°04′46″N, 127°13′07″E and 38°06′12″N, 127°13′08″, with elevations of 117 m and 148 m, respectively. The two southern sites, YS-1 and YS-2, located in Yangsan, Gyeongsangnam Province were positioned at 35°25′18″N, 128°56′20″E and 35°29′12″N, 128°59′08″E, with elevations of 73 m and 232 m, respectively. The northern sites were approximately 10 km apart, whereas the southern pair were approximately 8.5 km apart. Notably, the northern location PO-1 is situated approximately 270 m from the main channel of the Hantan River, which is 52 m wide and extends for 136 km. Given the significant influence of that temperature on amphibian metabolic activity, we hypothesized that regional climatic differences between the northern and southern sites would differentially affect calling activity.
At each site, ARUs (SM4-Mini, Wildlife Acoustics Inc., MA, USA) were installed on trees at heights ranging from 1.0 to 1.5 meters above ground level. The selected locations were situated away from major anthropogenic noise sources, such as roads and residential areas. Each ARU was powered by four D-cell alkaline batteries and employed a 32 GB SD memory card for data storage. Recordings were conducted at a sampling rate of 24 kHz in mono-channel mode, with the microphone oriented toward the center of the pond.
2.2 Data Collection and Analysis
To capture spatial variations in temperature, the recording periods were slightly adjusted between the northern and southern regions: from March 14 to June 14 at the northern sites, and from March 27 to July 5 at the southern sites. Given that anurans are primarily nocturnal (Duellman and Trueb 1994), ARUs were programmed to record calls for five minutes every hour during nighttime. Recordings began one hour after sunset and continued for a duration of 12 hours throughout the specified time intervals. The recordings were saved as WAV files and analyzed using Raven Pro version 1.6.5 (K. Lisa Yang Center for Conservation Bioacoustics, Cornell Lab of Ornithology 2024). In total, 4,242 files were collected, each corresponding to five minutes of recording per hour, accompanied by temperature data logged every minute, resulting in 27,662 air temperature records.
Species abundance of anurans at each site was estimated indirectly by summing the number of days with peak calls per hour over the study period (Nelson and Graves 2004). To quantify peak calls, we adapted the call index (CI) from the North American Amphibian Monitoring Program (NAAMP), which is widely used to measure for assessing calling activity. This index is a ranked, categorical metric that serves as an indirect indicator of species abundance and has been demonstrated to correlate with population size (i.e., the number of individuals within a population) (Nelson and Graves 2004). The call index (CI) was modified and then termed the Population Size Index (PSI) by the authors. They are defined as follows:
PSI-1 signifies the absence of any calls.
PSI-2 pertains to a single individual.
PSI-3 refers to two distinct individuals.
PSI-4 comprises three individuals who perform an intermittent chorus.
PSI-5 comprises three or more individuals performing a continuous chorus.
Within the dataset, PSI-4 and PSI-5 values were designated as “peak calls.” The intensity of breeding choruses serves as an indicator of the reproductive potential of the population, with the breeding population size potentially acting as a proxy for overall species abundance (Heyer et al. 2014). Significant regional temperature differences were assessed using t-tests, whereas variations among cohabiting species in the frequency (number) of days exhibiting peak calls were examined via one-way Analysis of Variance (ANOVA). Prior to conducting these statistical analyses, data normality was evaluated; non-parametric methods were employed when the data violated normality. To compare and visualize species abundance over time, the cumulative number of days on which PSI-4 and PSI-5 calls were detected during nocturnal periods was analyzed as two-dimensional distributions. Additionally, the influence of air temperature on each species’ PSI values was represented using two-dimensional distribution plots.
Given the observed non-linear relationships between the two variables (PSI over air temperature, and the cumulative number of days with detected peak calls over time), spline curves were utilized to model smooth, non-linear trends within the data. This analysis was conducted using the Fit Y by X platform in JMP software (version 18.0; SAS Institute Inc., Cary, NC, USA). The spline model was generated with the software automatically determining the optimal knot placement based on the data distribution. The smoothing parameter was adjusted to minimize the residual sum of squares, and model fit was assessed using the root mean square error (RMSE). The resulting spline curve was plotted alongside the observed data points to visually evaluate the goodness-of-fit. All statistical analyses, including spline fitting, were performed using JMP 18.0, with statistical significance set at p < 0.05.
3. Results
During the recorded study period, the mean air temperatures at the northern sites (PO-1 and PO-2) were 13.40°C (SE = 0.07) and 13.58°C (SE = 0.07), respectively, whereas those at the southern sites (YS-1 and YS-2) were 16.42°C (SE = 0.06) and 16.35°C (SE = 0.06). Overall, the mean air temperature in the southern region (16.38°C) was 2.9°C higher than that in the northern region (13.48°C), and this difference was statistically significant (t = 43.162, p < 0.0001). No significant difference in air temperature was observed between the two southern sites (t = −0.7630, p = 0.4455), while small but statistically significant difference was detected between the two northern sites (t = 1.807, p = 0.035).
Five anuran species were identified through a visual analysis of spectrograms of calls recorded by ARUs: the black-spotted pond frog (Pelophylax nigromaculatus), the Korean large brown frog (Rana uenoi), the Japanese tree frog (Hyla japonica), the Oriental fire-bellied frog (Bombina orientalis), and the Korean stream frog (Rana huarenensis). Species identification was based on distinctive call parameters, including call or note duration (seconds), dominant frequency (Hz), and call or note interval (seconds). Furthermore, vocal identification was corroborated by referencing previous studies (Park et al. 1996, Park and Yang 1997, Sung et al. 2005, and Bae et al. 2022), which collectively represent 71 % (northern region) and 67% (southern region) of the anuran species known to inhabit in the study area (Tables 1, 2) (NIE 2024). Among the detected species, R. huarenensis was observed exclusively at one northern site (PO-1), whereas R. uenoi, B. orientalis, P. nigromaculatus, and H. japonica were recorded at all four study sites.
Table 1
Periods of calling activity and peak calls for 5 species detected with ARUs (Northern region)
Table 2
Periods of calling activity and peak calls for 4 species detected with ARUs (Southern region)
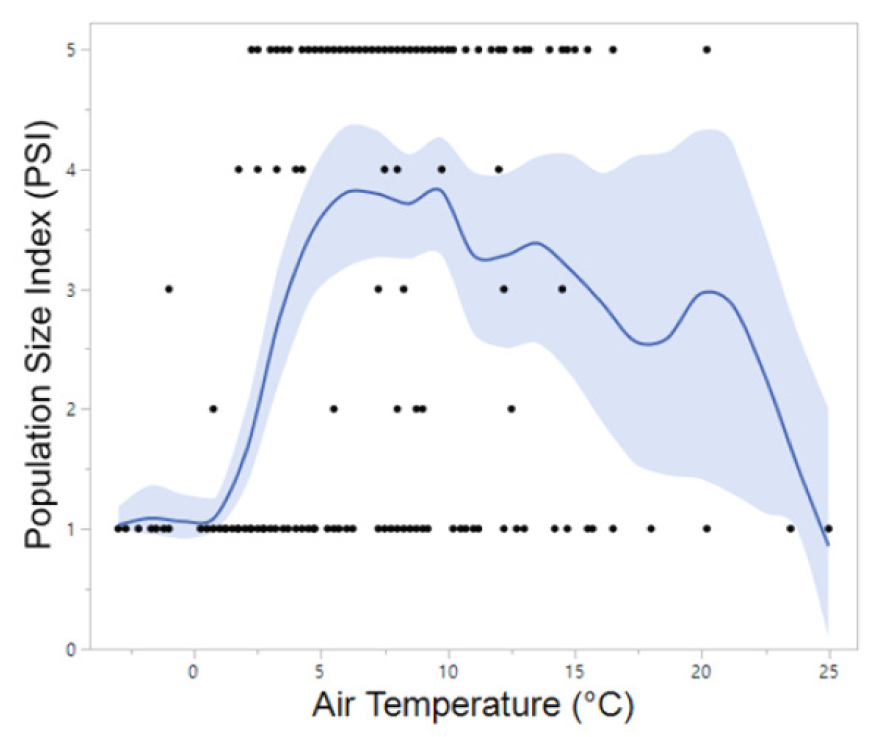
For R. uenoi, their advertisement calls may have been detected as early as the deployment of the ARUs in mid-March, precluding precise determination of the initial call onset date. Notably, this anuran species exhibited the earliest cessation of vocalization among all species recorded by the ARUs with calls terminating early and late April. In contrast, H. japonica and B. orientalis initiated calling up to 60 days later than R. uenoi and demonstrated the longest calling duration, with vocalizations detected until the final recording days in June and July at one northern site (PO-1) and two southern sites (YS-1 and YS-2). Four species — H. japonica, P. nigromaculatus, B. orientalis, and R. uenoi — displayed peak calling activity (PSI-4 and PSI-5), indicative of overlapping calls among species (chorusing), whereas R. huarenensis did not reach PSI-4 or PSI-5 and was detected on sporadically via single calls over two days. Regionally, calling periods of R. uenoi concluded nearly 15 to 25 days earlier at the northern sites compared to the southern sites, although peak calls (PSI-4 and PSI-5) ended almost simultaneously (March 29 to April 4) in both regions. Analysis of PSI distribution along an air temperature gradient revealed that peak calls of R. uenoi were most frequently recorded between 4°C and 15°C, with fewer occurrences below 4°C or above 15°C (Fig. 2). Comparatively, their peak calls were less frequent above 15°C than below 5°C.
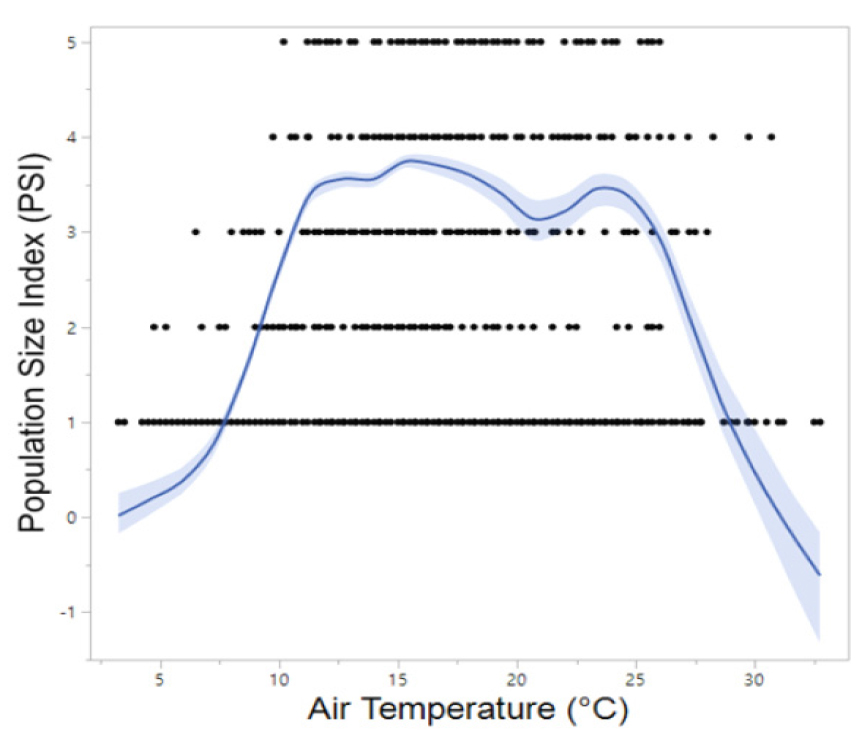
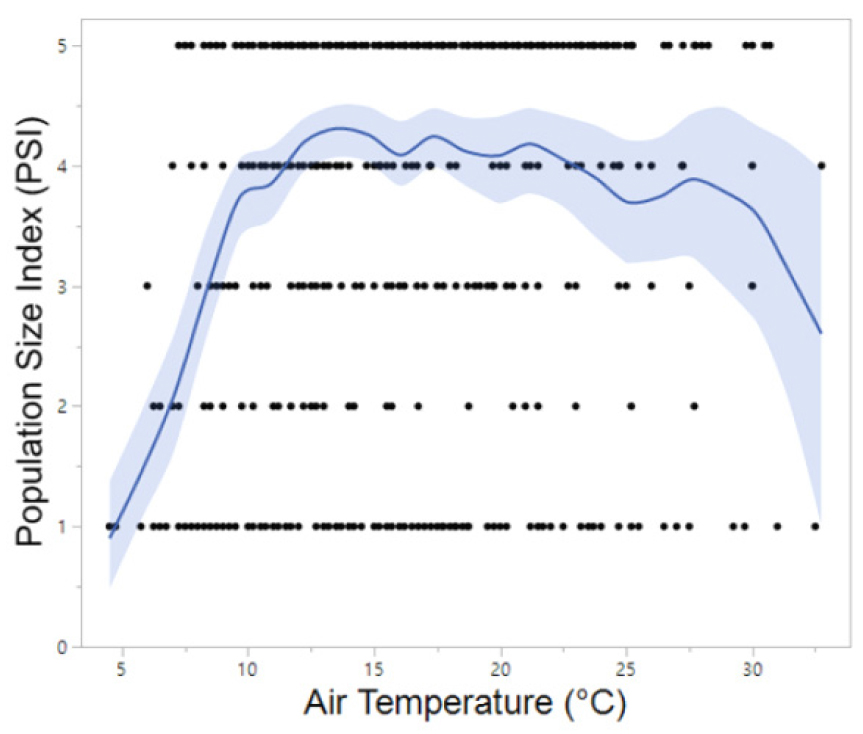
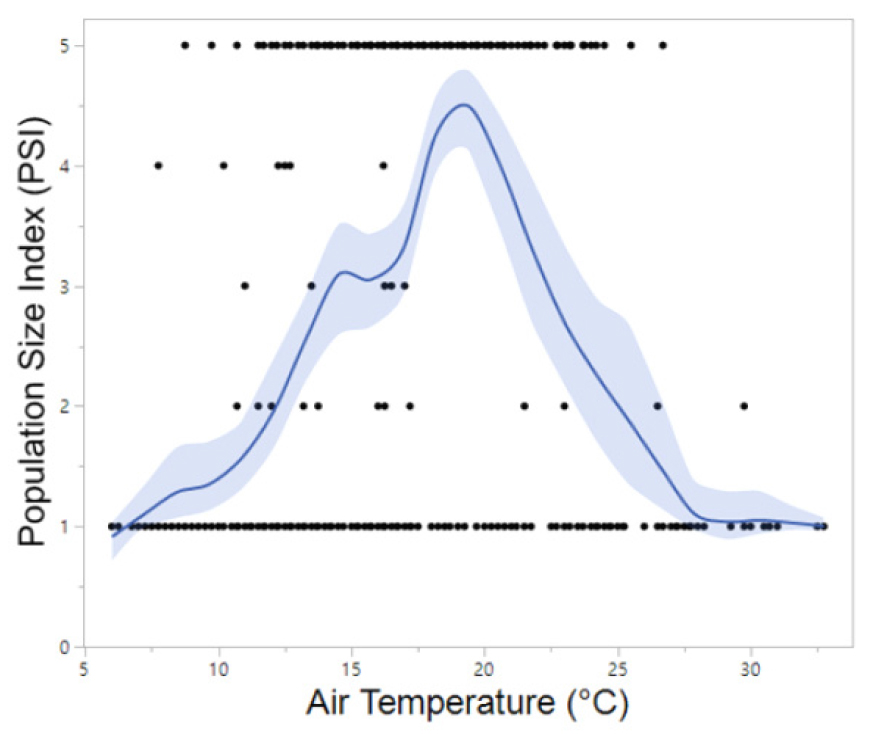
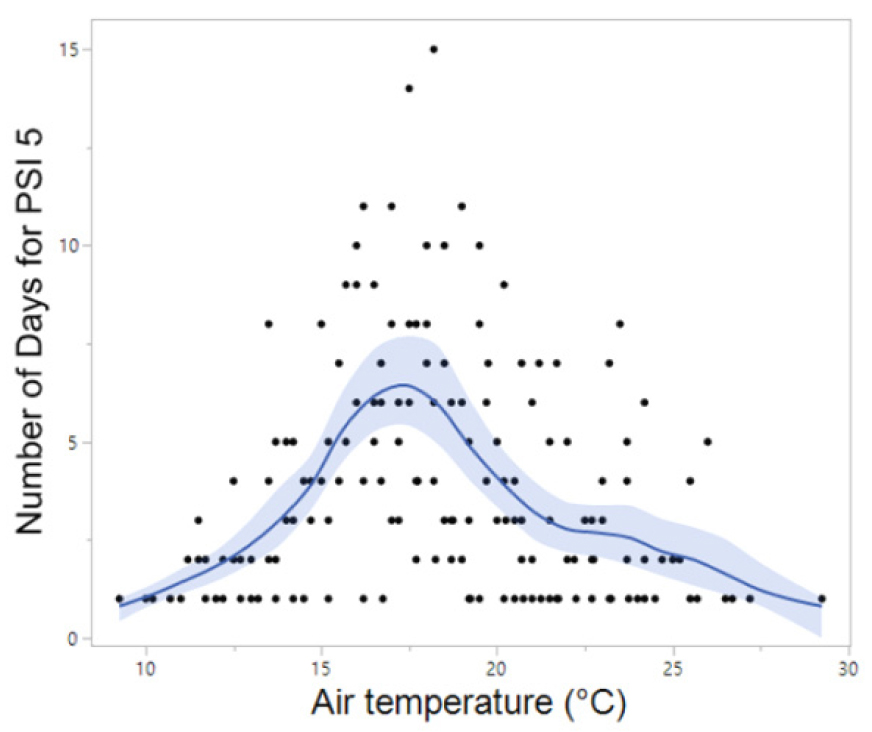
Meanwhile, B. orientalis, which is also commonly found in the forested valleys of Korea, began calling up to one month earlier at southern sites (late March to mid-April) compared to northern sites. The majority of B. orientalis calls (90%) were recorded within a temperature range of 10°C to 24°C, with peak calling activity occurring primarily between May and July at 14°C to 24°C, which is notably higher than that observed for R. uenoi (Fig. 3). Among the five species detected, P. nigromaculatus exhibited the broadest temperature range for calling activity (6°C to 33°C) and also demonstrated peak calling over the widest temperature window (7°C to 25°C). These findings suggest that P. nigromaculatus is the least temperature-sensitive and the most thermally adaptable species (Fig. 4). Similarly, H. japonica displayed a wide temperature range for calling activity (8°C to 30°C), with peak calls detected between 10°C and 27°C (Fig. 5). Notably, PSI-5, characterized by an uninterrupted chorus, was predominantly observed in H. japonica within the temperature range of 15°C to 21°C (Fig. 6).
3.1. Regional Comparison of Nocturnal Diel Peak Call Distributions: Northern versus Southern Regions
The nocturnal distributions of peak calls for four species were compared between two regions (Figs. 7, 8, 9, 10). For all species except P. nigromaculatus, the frequency of peak calls increased approximately one hour after sunset, with peak activity predominantly occurring between 21:00 and 22:00, followed by a gradual decline throughout the night. This pattern resulted in a right-skewed distribution. In contrast, P. nigromaculatus exhibited a consistent frequency of peak calls from 21:00 until 03:00 in the northern region. Additionally, in the southern region, its peak call frequency gradually increased from evening until 03:00, after which it steadily declined. These findings indicate that P. nigromaculatus maintains peak calling activity during late night and dawn, unlike the other species, which primarily exhibit peak calls during the evening and early night.
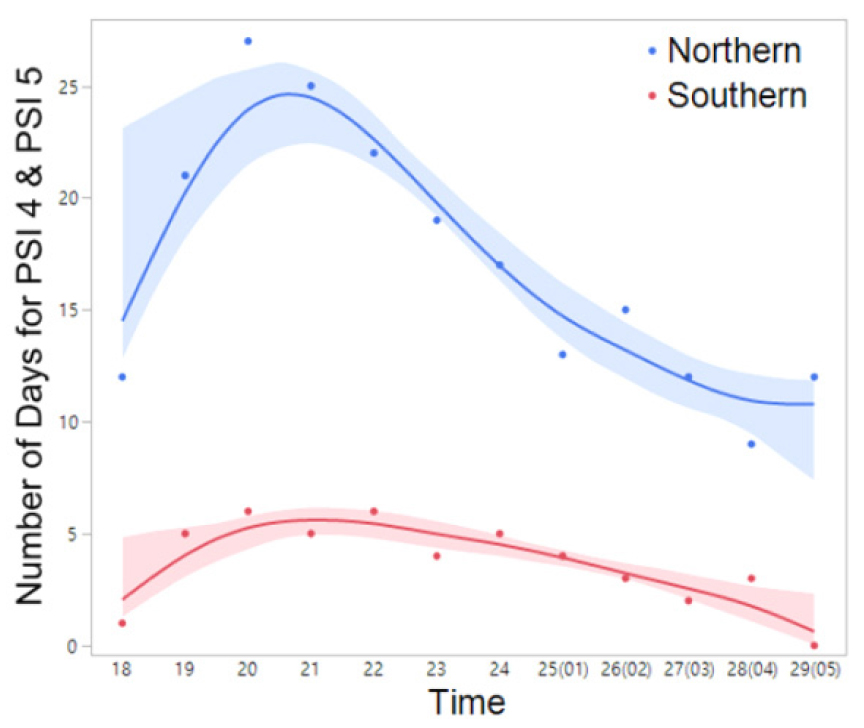
Fig. 7
The frequency (number) of days exhibiting nocturnal peak calls (PSI-4 and PSI-5) of R. uenoi in the northern and southern regions throughout the duration of the study period (March 14 to April 16). The spline curves represent the estimated nonlinear associations between PSI and air temperature. Blue and red shaded areas denote the 95% confidence limits.
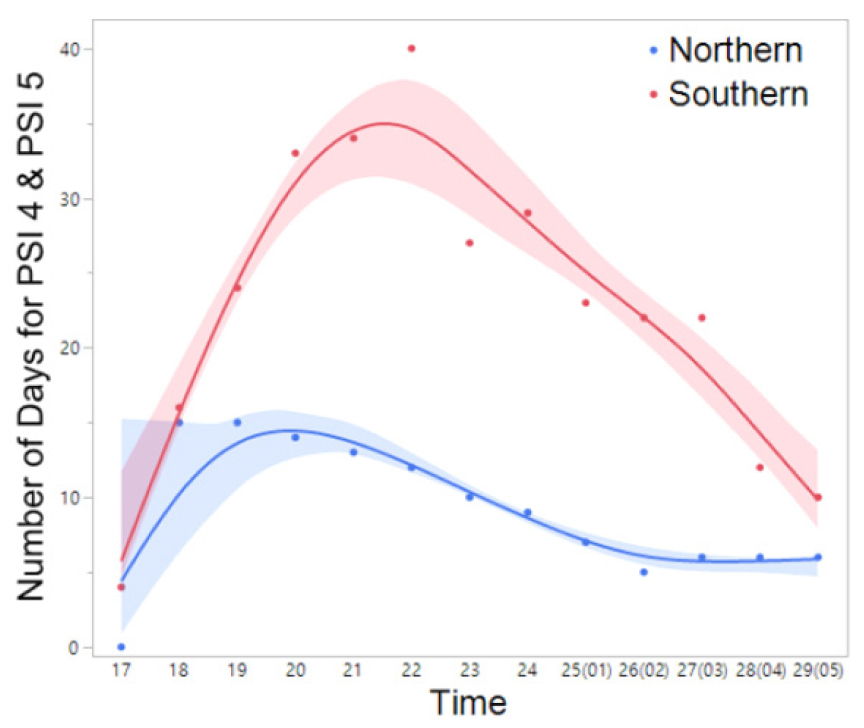
Fig. 8
The frequency (number) of days exhibiting nocturnal peak calls (PSI-4 and PSI-5) of B. orientalis in the northern and southern regions throughout the duration of the study period (March 14 to July 5). The spline curves represent the estimated nonlinear associations between PSI and air temperature. Blue and red shaded area denote the 95% confidence limits.
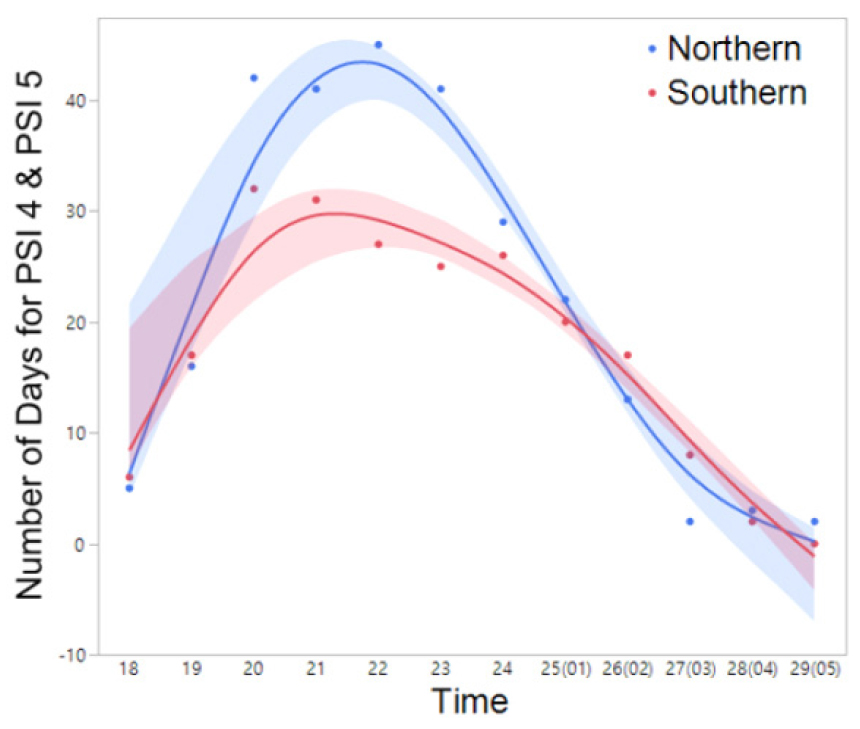
Fig. 9
The frequency (number) of days exhibiting nocturnal peak calls (PSI-4 and PSI-5) of H. japonica in the northern and southern regions throughout the duration of the study period (March 14 to July 5). The spline curves represent the estimated nonlinear associations between PSI and air temperature. Blue and red shaded area denote the 95% confidence limits.
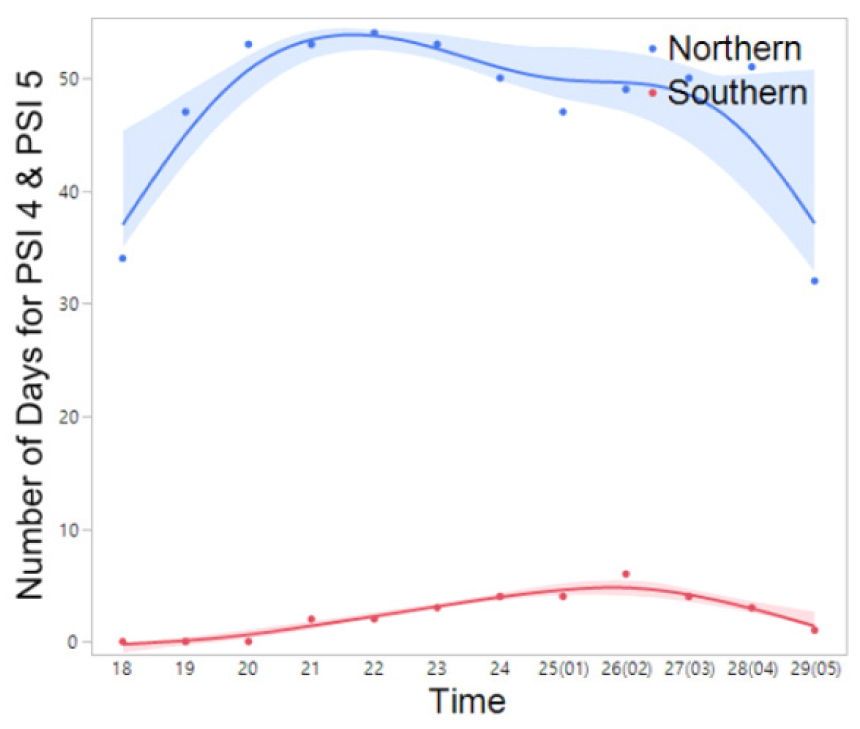
Fig. 10
The frequency (number) of days exhibiting nocturnal peak calls (PSI-4 and PSI-5) of P. nigromaculatus in the northern and southern regions throughout the duration of the study period (March 14 to July 5). The spline curves represent the estimated nonlinear associations between PSI and air temperature. Blue and red shaded area denote the 95% confidence limits.
3.2. Comparison of Distribution of Peak Calls Among Cohabiting Anurans
The nocturnal distributions of peak calls generally exhibited a right-skewed pattern across the examined species. However, comparative analyses revealed variability in the timing of peak calls among cohabiting species (Figs. 11, 12, 13, 14), with the exception of R. uenoi, whose terminal calls occurred significantly earlier than those of the other species. These interspecific differences were statistically significant at one northern site (PO-1: χ² = 26.0711, p < 0.0001) and one southern site (YS-1: χ² = 11.8009, p = 0.0027). Although differences were not statistically significant at PO-2 (χ² = 2.9741, p = 0.2260) and YS-2 (χ² = 3.1894, p = 0.2030), temporal variation among the studied species was still evident. These findings suggest that species reduce their peak calling times to minimize acoustic interference and interspecific competition within shared habitats (Canelas and Bertoluci 2007). Among the cohabiting species, B. orientalis exhibited, on average, the earliest nocturnal peak call frequency across the studied sites, followed by H. japonica, and P. nigromaculatus.
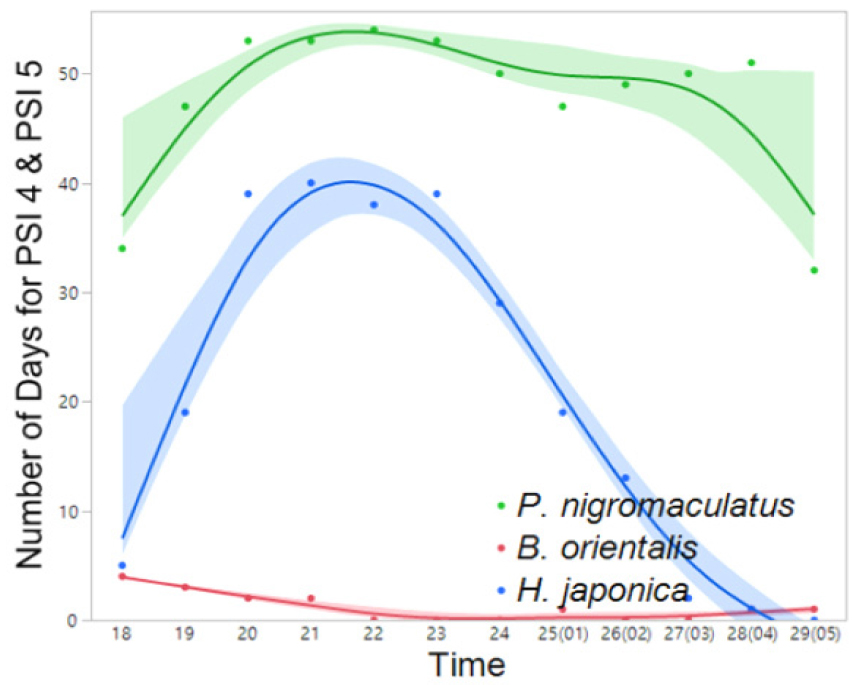
Fig. 11
Interspecific variation in the frequency (number) of days exhibiting nocturnal peak calls (PSI-4 and PSI-5) in PO-1 (March 14 to June 14). The spline curves represent the estimated nonlinear associations between PSI and air temperature. Green, blue, and read shaded areas denote the 95% confidence limits.
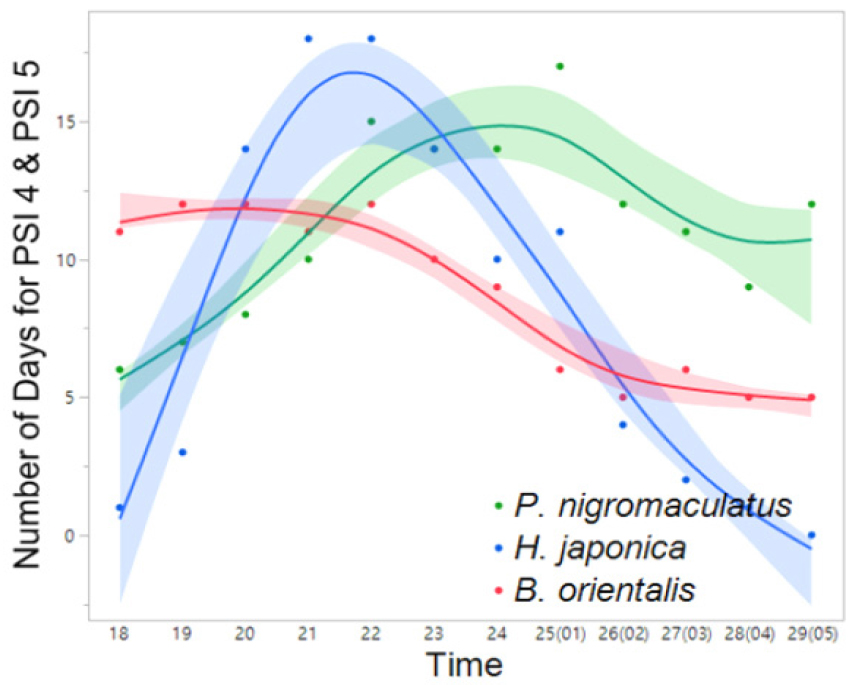
Fig. 12
Interspecific variation in the frequency (number) of days exhibiting nocturnal peak calls (PSI-4 and PSI-5) in PO-2 (March 14 to June 8). The spline curves represent the estimated nonlinear associations between PSI and air temperature. Blue, green, and red shaded areas denote the 95% confidence limits.
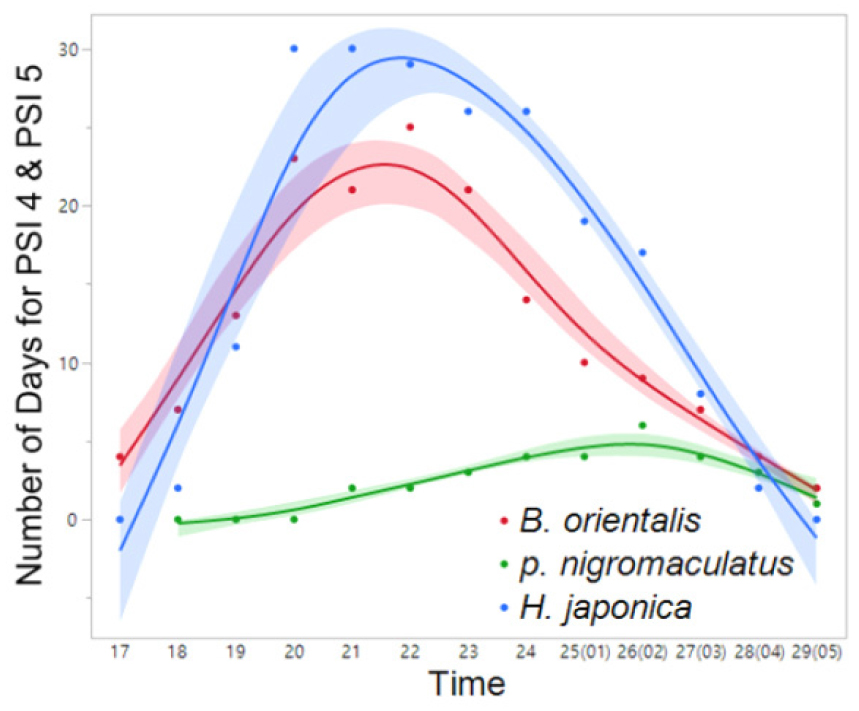
Fig. 13
Interspecific variation in the frequency (number) of days exhibiting nocturnal peak calls (PSI-4 and PSI-5) in YS-1 (March 27 to July 5). The spline curves represent the estimated nonlinear associations between PSI and air temperature. Blue, red, and green shaded areas denote the 95% confidence limits.
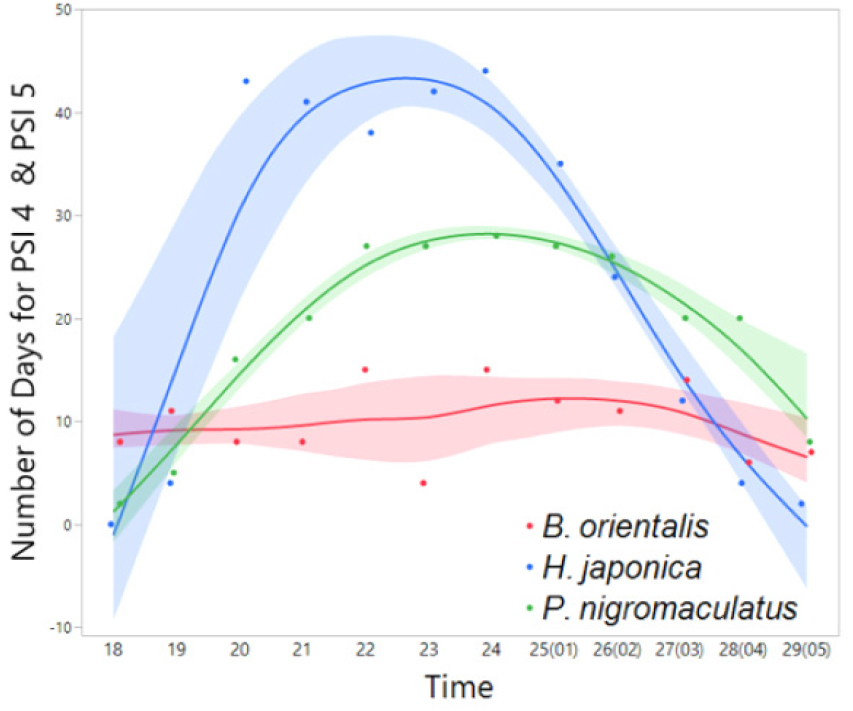
Fig. 14
Interspecific variation in the frequency (number) of days exhibiting nocturnal peak calls (PSI-4 and PSI-5) in YS-2 (March 27 to July 5). The spline curves represent the estimated nonlinear associations between PSI and air temperature. Green, blue, and read shaded areas denote the 95% confidence limits.
4. Discussion
In temperate habitats, where temperature exhibits distinct seasonal fluctuations, optimal amphibian breeding activity generally occurs during spring and summer, when temperature and precipitation conditions are favorable (Wells 1977, Do et al. 2021). As outlined in the Introduction, the present study aimed to determine the optimal nighttime period for detecting anurans by investigating their call activity and peak call frequencies in relation to regional climatic variation, particularly temperature. Generally, the frequency of peak calls increased with rising temperatures from 0°C upward; however, each species exhibited a specific temperature range within which calling activity was optimal, with frequencies of peak calls declining outside this range. During a nighttime cycle, cohabiting species have displayed temporal partitioning of peak calls, presumably trying to minimize interspecific competition by spacing calls. Such species interactions may lead to the exclusion of interior species or mitigate interference through temporal segregation (Schoener 1974).
4.1. R. uenoi
In artificial wetlands consisting of rice paddies and ponds in southern Gyeonggi Province, Korea, it was observed that the Korean large brown frog (Rana dybowskii, renamed Rana uenoi in 2014) occasionally vocalized at subzero temperatures. This was demonstrated through a year-long, 24-hour recording survey with five-minute recordings each hour (Yoo and Jang 2012). In the present study, calls of R. uenoi characterized by PSI-3 and PSI-4 were recorded twice at subzero temperatures (−1.5°C and −1.0°C) during the early morning hours (02:00 and 04:00) in mid-March. Aside from these infrequent occurrences, calling activity was predominantly observed at temperatures above freezing. The frequency of peak calls, specifically, the number of PSI-4 and PSI-5 calls, increased from 0°C to approximately 10°C, followed by a gradual decline, indicating reduced calling activity at temperatures exceeding 10°C. Notably, R. uenoi was the sole species to vocalize when other cohabiting species were inactive. The previous study similarly reported that R. uenoi called at lower mean air temperatures and ceased calling earlier than H. japonica and P. nigromaculatus, the latter of which continued calling for up to five months longer. Our findings are consistent with these observations, demonstrating that R. uenoi exhibits both peak calling activity and cessation earlier than H. japonica and P. nigromaculatus , regardless of the geographic region. Although the precise onset dates of call activity and peak calls could not be ascertained, the occurrence of R. uenoi emitting peak calls at lower temperatures likely indicates an earlier initiation of calling relative to other species.
A nationwide amphibian survey conducted over four years across 135 habitats revealed that 55% of observed R. uenoi individuals were found at temperatures ranging from 5°C to 15°C (NIBR 2025). Consistently, the present study found that, over 50% of R. uenoi detections occurred in habitats where air temperatures ranged between 5°C and 16°C, indicating this range as optimal for the survival of this early spring species in the Republic of Korea. Although peak calling activity of the Korean large brown frog ceased by early April in both study regions, calls persisted until mid- to late April at southern sites. The earlier cessation of R. uenoi calls at northern sites may be attributed to the onset of R. nigromaculatus calls in early April within that geographic area. The optimal temperatures for advertisement calls and the relatively higher call amplitude of R. nigromaculatus may have displaced R. uenoi in the breeding competition (NIBR 2025). Notably, when R. nigromaculatus began calling for two consecutive days (April 8 and 9) at site PO1, the mean air temperature at the northern site was 19.5°C, a temperature more conducive to R. nigromaculatus calling activity. The nationwide survey additionally reported that 74.9% of observed R. nigromaculatus individuals preferred ambient air temperatures ranging from 15°C to 30°C. In contrast, at the southern site designated YS-1, vocalizations of R. uenoi were documented until April 24, approximately 20 days later than the last recorded calls at northern sites. The mean air temperature on April 23 and 24 at this southern site (YS-1) was 13.4°C, still within the active range for R. uenoi. At another southern site (YS-2), when R. uenoi calling ceased on April 16, the mean air temperature was 15.7°C, suggesting that air temperatures became more favorable for P. nigromaculatus to initiate calling in mid-April at this location.
4.2. R. huarenensis
R. huarenensis was detected exclusively at the northern site (PO-2), where sporadic individual calls were recorded over a two-day period; however, no peak calling activity was observed. The infrequent detection of this species can be attributed to the absence of vocal sacs, resulting in weak calls that may have escaped detection by ARUs. Furthermore, habitat characteristics likely influenced the limited detection rates, as R. huarenensis typically breeds beneath boulders in mountain streams and prefers environments with large rocks (Lee and Park 2016, Choi et al. 2018). Among the four study sites, PO-2 contained the largest natural boulders and maintained consistent water availability, thereby offering the most suitable breeding habitat. Despite these optimal reproductive conditions, PO-2 was less conducive to acoustic call recording.
4.3. B. orientalis
Previous research has demonstrated that B. orientalis remains inactive or enters hibernation at temperatures below 5°C, as evidenced by a biotope study conducted in Gyeonggi Province in Korea (Yoon et al. 2008). In the present study, the lowest temperature at which B. orientalis was recorded was 4.8°C. Collectively, these findings suggest that approximately 5°C represents the lower thermal threshold for the species’ activity nationwide. A comprehensive amphibian survey indicated that 95% of B. orientalis occurrences across the country were observed within a temperature range of 5°C to 30°C (NIBR 2025), which closely aligns with our findings regarding the optimal thermal range for survival. Specifically, in the current study, 95% of calls occurred between 8°C and 26°C, with peak calling activity recorded between 10°C and 31°C. Jeon et al. (2019) reported that B. orientalis calls were detected at Pyeongdome Wetland in Mudeungsan National Park, in southwestern Korea, from May 10 to August 12, corroborating our observation that peak calling activity at northern sites (PO-1, PO-2) occurred in early May. In contrast, calling activity at southern sites (YS-1, YS-2) commenced earlier, from late March to mid-April, likely attributable to milder spring temperatures. Notably, the mean nighttime temperature on the first day of calling (March 27) was 11°C, consistent with the nationwide survey (NIBR 2025). Additionally, another study reported that B. orientalis bred and exhibited peak calling activity between 18°C and 22°C in Gangwon Province and Jeju Island on the Korean peninsula (Song 2023).
4.4. H. japonica
The tree frog, H. japonica, is a widely distributed amphibian species found throughout Northeast Asia, including Korea, China, and Japan. During the breeding season, which typically spans from May to August, males produce advertisement calls to attract females (Yoo et al. 2019, NIBR 2025). In the present study, H. japonica demonstrated a longer duration of peak calling activity compared to any other sympatric species. As a prolonged breeding species characterized by continuous breeding throughout the season, H. japonica appears to conserve energy by synchronizing choruses with conspecifics, thereby reducing individual energy expenditure while enhancing reproductive efficiency and immune function (Well 1977). Regarding behavioral responses to temperature, peak calling activity was most frequently observed at approximately 20°C. This finding aligns with previous research conducted in rice paddies in Chungcheongnam Province, Korea, which reported increased calling activity of D. japonicus (synonymous with H. japonica) at temperatures above 20°C (Park and Do 2023).
The onset of calling activity at YS-2 occurred approximately one month later than at YS-1, despite both sites being located within the same southern region. This delay may be attributed to a higher sea level at YS-2, which could have influenced the timing of calling behavior in H. japonica. Furthermore, unmeasured environmental factors, such as barometric pressure or wind exposure, may have contributed to this discrepancy, especially considering that PO-2 was situated at a higher elevation (213 m). Supporting this hypothesis, previous studies have reported that approximately 70% of H. japonica populations nationwide are found below 200 m elevation (NIBR 2025).
4.5. P. nigromaculatus
Song et al. (2020) reported that the chorus activity (i.e., peak calls) of P. nigromaculatus began on April 8 in a natural wetland on Heuksando Island, Jeollanam Province, Korea. Similarly, Yoo et al. (2019) observed that P. nigromaculatus was most abundant in April within reclaimed wetlands of Chungcheongnam Province, Korea. Consistent with these findings, the present study documented the onset of frog chorus activity on April 8 in the northern region and April 17 in the southern region. A nationwide survey conducted by the National Institute of Biological Resources (NIBR 2025) indicated that 81% of P. nigromaculatus individuals observed across Korea were found at ambient temperatures ranging from 0°C to 25°C. Given that calling activity ceased in early to mid-June when mean air temperatures reached approximately 25°C to 26°C, the results of the present study align with the nationwide data. Notably, calling activity declined sharply at temperatures exceeding 26°C. In both contexts, the chorus activity of P. nigromaculatus extended later into the night relative to sympatric species, frequently peaking during the early morning hours. This temporal calling pattern may function to reduce acoustic competition or interference with H. japonica and B. orientalis, whose peak calling times occur around 21:00 to 22:00 hours. Hirai and Matsui (2002) demonstrated that inter-individual variation in body size influences prey size selection, thereby facilitating species coexistence. Such trophic partitioning may be reflected in the temporal segregation of calling activity, with P. nigromaculatus preferentially vocalizing during later periods (Schoener 1974). Furthermore, Ahn et al. (2021) reported that P. nigromaculatus exhibits microhabitat segregation from the closely related P. chosenicus, a behavior shown to enhance reproductive success.
5. Conclusions
This study addresses to the relatively limited body of literature on animal vocalization within the Republic of Korea. The results are considered as an accurate representation of the bioacoustic behavior of the focal species, particularly given that the study was carried out in natural environments characterized by minimal anthropogenic noise. Globally, anuran species, including frogs and toads, produce species-specific vocalizations during the breeding season (Gerhardt et al. 1994, Filer et al. 2021). Our findings indicate that conspecific individuals display comparable diel peak calling patterns irrespective of geographic location. However, calling behavior varied among species in response to interspecific interactions with sympatric competitors, suggesting temporal partitioning as a mechanism to mitigate acoustic interference. The coexistence of multiple species depends upon differential resource utilization across spatial and temporal scales, with amphibians demonstrating species-specific reproductive timing to optimize breeding success. When temporal avoidance is not feasible, multiple breeding events may occur within a single season. In permanent aquatic habitats, such as those studied here, water and air temperature are critical factors influencing reproductive success, with peak calling activity temporally aligned with favorable thermal conditions.
This study contributes to the current understanding of anuran calling phenology in the Republic of Korea and provides valuable bioacoustic data for commonly encountered frog and toad species. Importantly, it offers practical recommendations for optimizing survey periods and timing in amphibian field research. The results indicate that autonomous recording unit (ARU)-based monitoring can effectively complement traditional survey methods, especially in visually challenging forested habitats. Despite regional climatic variability, conspecific individuals exhibited consistent diel peak calling times, whereas sympatric species demonstrated temporal partitioning of calling peaks, likely as a strategy to reduce interspecific competition. A comprehensive understanding of these species-specific calling patterns can assist field researchers in scheduling monitoring efforts at optimal times, thereby enhancing detection probabilities and improving quality for population assessments.