Original Article

Ecology and Resilient Infrastructure. 30 September 2021. 154-163
https://doi.org/10.17820/eri.2021.8.3.154

ABSTRACT


MAIN

  • 1. 서 론

  • 2. 연구 방법

  •   2.1 종 출현 위치 자료

  •   2.2 환경변수

  •   2.3 분포 모델링

  • 3. 결과 및 고찰

  •   3.1 변수 및 최적 모델 선정

  •   3.2 모델 평가

  •   3.3 분포 적합지 예측

  • 4. 결 론

1. 서 론

기온상승과 같은 기후변화는 생물의 휴면타파, 개화기, 개엽기, 출현시기, 철새이동, 산란 등 생물계절 (phenology)에 큰 혼란을 줄뿐만 아니라 (Hegland et al. 2009), 지리적 분포범위를 크게 변화시키는 (Foden et al. 2008, Hegland et al. 2009) 등 생물다양성과 생태계에 매우 부정적이며 불가역적인 영향을 미치는 것으로 밝혀졌다. 많은 선행 연구에서 기후변화가 다양한 생물종의 적합 서식지를 변화시킨다는 것을 보고하였다 (Sambaraja et al. 2012, IPCC 2014, Biber-Freudenberger et al. 2016, Jo et al., 2017).

국가 간 물자 및 인구 이동 등 교류가 활발해지면서 국내 외래식물 (alien/exotic plant)이 증가하고 있다. 즉, 의도적 또는 비의도적으로 국외에서 국내로 새롭게 유입된 도입식물 (introduced plant)과 도입 후 국내 환경에 적응하여 정착한 귀화식물 (naturalized plant)이 급속히 증가하고 있다 (Lee et al. 2011). 우리나라의 귀화식물은 1980년대 110분류군에서 2010년대에 약 300여종으로 증가한 것으로 확인되었다 (Ryu et al. 2017). 국가 간 교류 증대 이외에 새로운 외래식물의 유입 및 정착을 증가시키는 요인으로 기후변화를 들 수 있을 것이다. 기후변화는 기온, 강수량 등 식물의 서식지 환경을 변화시키고, 변화된 서식지 환경에 잘 적응한 외래식물들은 정착하고 그 분포역을 확대해 나갈 것이다. 다양한 외래식물의 정착은 그 지역의 식물 종다양성을 감소시키고, 양분순환율을 변화시킴으로써 생태계서비스와 인간 복지에 영향을 주는 것으로 알려졌다 (Hejda et al. 2009, Vilà et al. 2011). 최근에는 기후변화와 관련한 외래식물의 분포 변화 및 관리방안 등에 관한 연구가 국내외에서 활발히 이루어지고 있다 (Hellmann et al. 2008, Cho and Lee 2015, Hoveka et al. 2016, Lee et al. 2016, Rockwell-Postel et al. 2020, Fang et al. 2021).

종분포모델 (SDM, species distribution model)은 환경변수를 종 출현 기록과 연관시켜 생태학적 또는 진화적 원인에 대한 통찰력을 얻거나 대규모 범위에서 서식지의 적합성을 예측하는데 도움이 된다 (Elith and Leathwick, 2009). SDM 모델 중 MaxEnt는 최대 엔트로피 (maximum entropy)의 원리를 이용하여 존재 유무를 환경변수와 연관시켜 종의 생태적 지위 및 잠재적인 지리 분포를 추정한다 (Phillips et al., 2006). MaxEnt는 사용이 간편하고, 부존재 자료가 필요 없을 뿐만 아니라, 적은 자료와 불규칙하게 샘플링된 자료 및 사소한 위치 오류에도 강력한 결과를 얻을 수 있어서 국내외 많은 학자들에 의해서 널리 사용되고 있다 (Elith et al., 2006, Hernandez et al., 2006, Person et al., 2007, Ortega-Huerta and Peterson 2008, Nam et al., 2018). 특히, 희귀하거나 멸종위기종의 보존 문제의 잠재적 분포를 모델링하고 (Wilting et al., 2010, Clements et al., 2012), 생태학적 지위를 분리하고 (Kalkvik et al., 2012), 기후변화 따른 향후 분포를 예측하는데 (Hu and Jiang, 2011) 매우 인기 있는 도구이다.

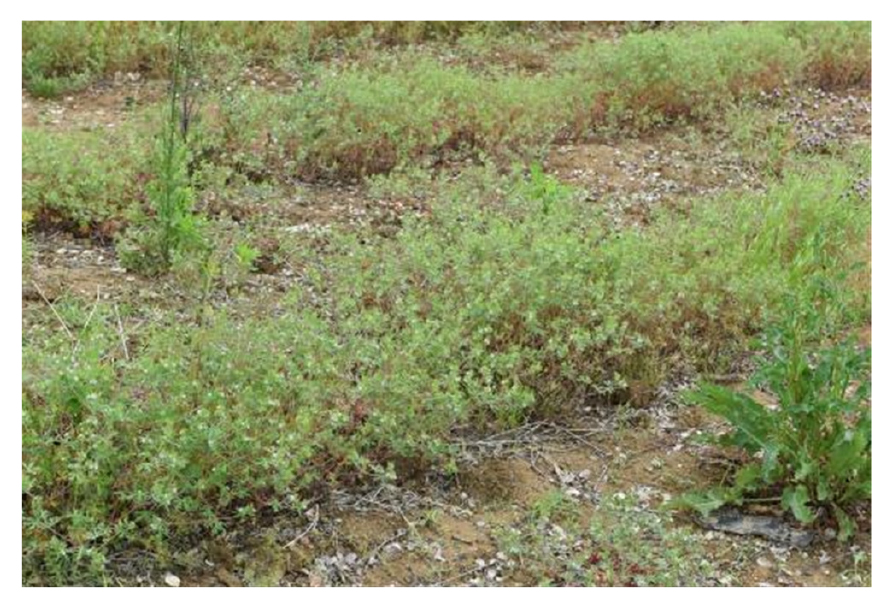
미국쥐손이 (Geranium carolinianum)는 북아메리카 동부가 원산으로 일년생 초본이며 (Aedo 2000), 중국, 일본, 북유럽, 남아메리카, 대만 등에서도 도입되어 정착한 것으로 보고되어 있다 (Gama-Arachchige et al. 2011, Liu et al. 2018). 우리나라에는 1995년에 제주도와 서울에서 처음 귀화식물로 보고되었고 (Jeon 1995), 2001년에는 제주도와 남부・중부 지방에 분포하는 것으로 알려졌다 (Park 2001). 미국쥐손이는 미국, 중국에서 딸기, 유체, 밀 등의 재배에 심각한 피해를 주는 것으로 알려져 있으며 (Liu et al., 2018, Sharp and Boyd 2020), 국내에서도 현재 농경지 내외부에서 집단적으로 번성하고 있는 상황이다 (Fig. 1). 국내에서 현재까지 미국쥐손이에 의한 작물의 피해는 보고되어 있지 않지만, 국내에 도입 및 정착 후 단기간에 국내 환경에 적응하여 확산하는 것을 볼 때, 향후 자연 생태계뿐만 아니라 작물의 생산성에도 영향을 미칠 가능성이 있을 것으로 판단된다.

따라서, 본 연구에서는 국내에 유입되어 서식하고 있는 미국쥐손이에 대한 출현 지점과 출현 지점의 기후 환경 자료를 기반으로 SSPs 시나리오에 따른 미래 적합 서식지의 변화를 예측하였다.

https://static.apub.kr/journalsite/sites/kseie/2021-008-03/N0190080303/images/kseie_08_03_03_F1.jpg
Fig. 1

Image of Geranium carolinianum population growing in crop land.

2. 연구 방법

2.1 종 출현 위치 자료

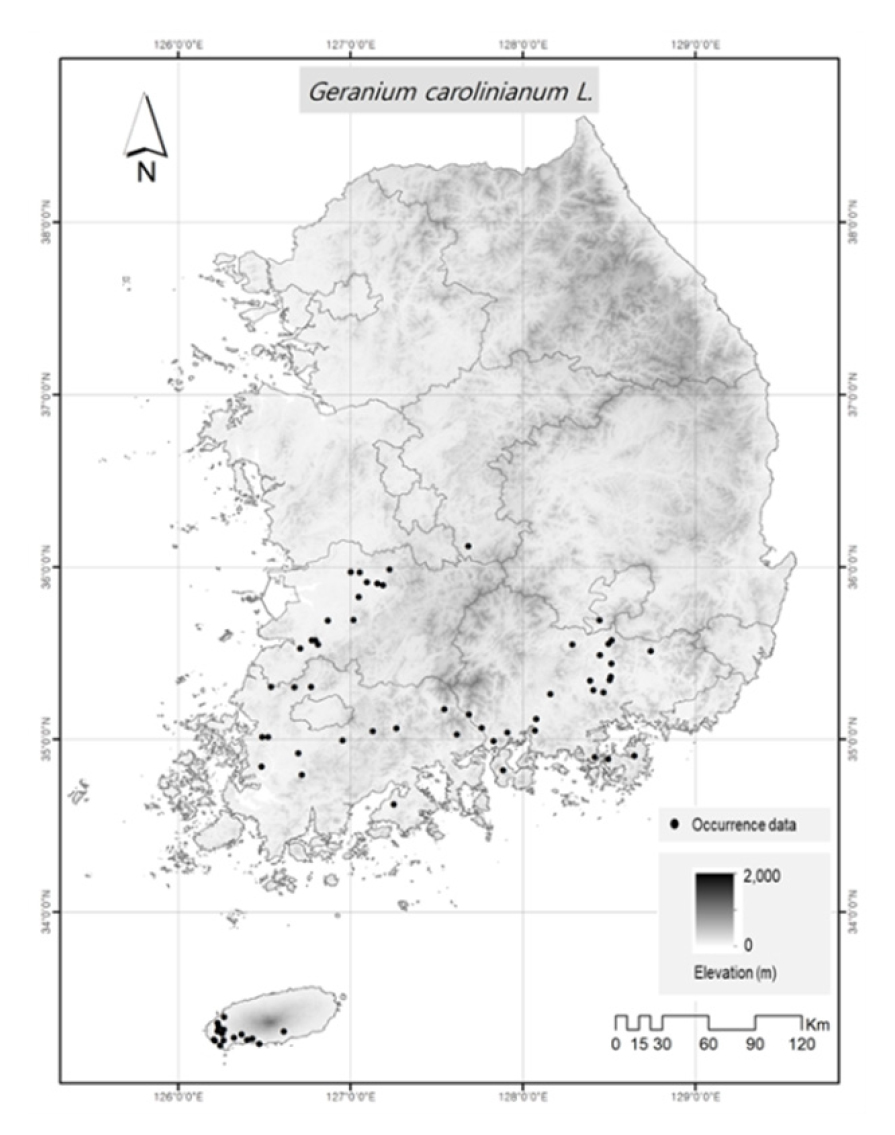
미국쥐손이의 출현 위치 자료는 직접 현장 조사와 Global Biodiversity Information Facility database (GBIF, http://www.gbif.org/)에서 수집된 자료를 통합하여 사용했다. 현장 조사는 2018년부터 2020년 우리나라 전국을 대상으로 무작위로 수행하여 출현한 총 40지점의 GPS 좌표를 기록했다. GBIF에서는 총 28지점의 자료를 획득하여 총 68개 출현지점을 수집했다 (Fig. 2).

https://static.apub.kr/journalsite/sites/kseie/2021-008-03/N0190080303/images/kseie_08_03_03_F2.jpg
Fig. 2

Spatial distribution of occurrence records of G. carolinianum in South Korea.

2.2 환경변수

본 연구에서는 세계기후연구프로그램 (World Climate Research Programme, WCRP)의 CMIP6 (Coupled Model Intercomparison Project Phase 6)를 통해 제공되는 전 지구 규모의 SSPs (Shared Socioeconomic Pathways) 시나리오 자료를 사용하였다 (https://esgf-node.llnl.gov/search/cmip6/). IPCC 6차평가보고서에서는 SSP1-2.6, SSP2-4.5, SSP3-7.0, SSP5-8.5를 표준 경로로 사용하고 있으며, 본 연구에서는 그 중 SSP2-4.5와 SSP5-8.5를 사용하였다. SSP2-4.5는 기후변화 완화 및 사회경제 발전 정도를 중간 단계로 가정, 그리고 SSP5-8.5는 산업기술의 빠른 발전에 중심을 두어 화석연료 사용이 높고 도시 위주의 무분별한 개발이 확대될 것으로 가정한 기후변화 시나리오이다. 환경변수는 11개 GCM (Global Climate Model) (GFDL-ESM4, MRI-ESM2-0, CNRM-CM6-1, CNRM-ESM2-1, IPSL-CM6A-LR, MPI-ESM1-2-HR, UKESM1-0-LL, ACCESS-CM2, CanESM5, INM-CM4-8, INM-CM5-0)을 이용하여 생산한 3km 공간해상도의 20개 생물기후변수 (bioclimatic variables)를 사용하였다 (Table 1, O'Donnell and Ignizio 2012). CIMP6의 과거 재현기간은 2014년에 끝나는 것으로 설계되어 있으며, 2015년 이후 기간에 대하여 SSP 시나리오별 전망자료가 제공된다. 따라서, 본 연구에서는 2100년을 기준으로 동일하게 30년 기간을 고려할 수 있도록 다음과 같이 기준년대 및 미래 구간을 구분했다: 기준년대 (Historical period, 1981 - 2010), 근미래 (Near future, 2011 - 2040), 중미래 (Mid future, 2041 - 2070), 먼미래 (Far future, 2071 – 2100).

Table 1.

List of environmental variables used in the model development

Index Description Unit
bio01 Annual Mean Temperature °C
bio02 Annual Mean Diurnal Range °C
bio03 Isothermality %
bio04 Temperature Seasonality (Standard Deviation) °C
bio04a Temperature Seasonality (CV) %
bio05 Max Temperature of Warmest Month °C
bio06 Min Temperature of Coldest Month °C
bio07 Annual Temperature Range °C
bio08 Mean Temperature of Wettest Quarter °C
bio09 Mean Temperature of Driest Quarter °C
bio10 Mean Temperature of Warmest Quarter °C
bio11 Mean Temperature of Coldest Quarter °C
bio12 Annual Precipitation mm
bio13 Precipitation of Wettest Month mm
bio14 Precipitation of Driest Month mm
bio15 Precipitation Seasonality (CV) %
bio16 Precipitation of Wettest Quarter mm
bio17 Precipitation of Driest Quarter mm
bio18 Precipitation of Warmest Quarter mm
bio19 Precipitation of Coldest Quarter mm

모델 구동에 있어서 너무 많은 환경변수를 사용하는 것은 계산 시간 등 효율성에 영향을 미치며, 또한 상관성이 높은 변수의 사용은 결과 해석에 영향을 미친다 (Heikkinen et al. 2006, Dormann et al., 2013). 따라서, 본 연구에서는 초기모델에서 얻어진 각 변수의 퍼센트 기여율과 피어슨 상관계수를 이용하여 모델에 사용할 환경변수를 줄이고 적절한 변수를 선정했다. 우선 초기모델을 통하여 얻어진 결과에서 변수의 기여도가 1 미만인 변수를 제거했다. 초기모델에서는 ‘Random percentage’를 25로 설정하고, ‘Create response curves’, ‘Make pictures of predictions’, 및 ‘Do jackknife to measure variable importance’를 선택하고, 나머지 설정 값은 기본으로 하였다. 다음으로 1차 선정된 변수들 중 다중공선성을 가진 변수를 제거하기 위해 피어슨 상관계수를 확인했다. 만약 변수들 사이에 상관관계가 높은 경우는 (|r|>0.85) 초기모델 결과에서 기여도가 높은 하나의 변수만 선정했다.

2.3 분포 모델링

MaxEnt에는 feature class와 regularization multiplier라는 사용자가 변경할 수 있는 주요 매개변수가 있다. Feature는 복잡한 관계를 모델링할 수 있도록 모델에 사용된 다른 독립변수들의 수학적 변화의 종류를 의미한다 (Elith et al. 2010). 이러한 feature classes에는 L (linear), Q (quadratic), P (product), T (threshold), H (hinge), C (categorical) 6개가 있다. Regularization muliplier는 모델링에 사용된 feature class의 강도를 제어하여 모델의 복잡성 또는 과적합을 방지할 수 있다 (Elith et al., 2010, Morales et al., 2017). MaxEnt의 default parameters setting으로 분포 모델을 만들 수 있지만, 항상 최적의 모델을 만드는 것은 아니다 (Morales et al. 2017). 따라서 최적의 모델을 만들기 위해서는 여러 개의 다른 features 조합과 regularization multiplier의 설정을 통해 최적의 모델을 선택할 필요가 있다.

본 연구에서는 6개의 feature combination (L, LQ, H, LQH, LQHP, LQHPT)과 8개의 regularization parameters (0.5, 1, 1.5, 2, 2.5, 3, 3.5, 4)를 이용하여 전체 48개의 후보 모델을 만들었다. 최적의 모델을 선택하기 위해 MaxEnt (version 3.4.4)를 dismo package (Hijman et al. 2017)을 통해 통계프로그램 R에 탑재하여 ENMeval package (Muscarella et al. 2014)와 함께 구동하여 얻었고, 생성된 모델 중 AICc (corrected Akaike information criterion) 값이 가장 작은 모델을 최적 모델로 선정하였다.

MaxEnt 모델에서 한 가지 기본적인 가정은 평가 대상 지역이 전체적으로 또는 무작위로 조사되었다는 것이다 (Phillips et al. 2009). 하지만, 실제 모델에 사용되는 자료는 공간적으로 편향되어 있는 경우가 많다 (Phillips et al. 2009, Yuckulic et al. 2013, Kramer-Schadt et al. 2013). 따라서 본 연구에서는 bias layer를 생성하여 모델 구동에 사용했다.

최종 모델에서는 최적 모델에서 선정된 features를 선택하고, ‘regularization multiplier’에 값을 입력하였다. 또한, ‘Replicated run type’은 ‘Crossvalidate’로 ‘Replicates’는 10, ‘Max number of background points’는 10,000으로 설정하고 ‘Bias file’에 앞에서 생성한 bias layer를 추가하였다. 모델링 경과 얻어진 AUC값의 범위는 0.5에서 1사이이며, 값이 클수록 모형의 예측이 향상된다. 모델 예측 정확도는 AUC 값에 따라 5등급으로 구분될 수 있다 (Swets 1988): 0.5 - 0.6, fail; 0.6 - 0.7, poor; 0.7 - 0.8, fair; 0.8 - 0.9, good; 0.9 - 1.0, excellent. 각 생물기후변수의 중요도를 평가하기 위하여 Jackknife 검정을 수행했고, 반응곡선 (response curves)을 이용하여 각 환경변수 값과 분포확률의 관계를 파악하였다 (Phillips et al. 2006). 변수의 중요성은 기여도 (Percent Contribution)와 중요도 (Permutation Importane)를 통해서 측정될 수 있다. 기여도는 모델의 훈련과정에서 각 변수의 기여도를 바꿔가며 최적의 결과를 도출할 수 있도록 하는 방법이며, 중요도는 무작위 자료에 대한 모델 훈련 시 AUC 값을 감소시키는 변수의 중요성을 나타낸다 (Gill and Sangermano 2016, Cho et al. 2020). MaxEnt 모델링의 결과는 지표생물의 서식 적합성을 0에서 1사이로 표시한 것으로 서식지의 분포변화를 확인하기 위해 적합성을 동일한 간격 접근법 (equal interval approach)을 사용하여 5등급으로 구분하여 지도화하였다: 0 - 0.2 (non-suitable area), 0.2 - 0.4 (low-suitability area), 0.4 - 0.6 (general-suitability area), 0.6 - 0.8 (medium-suitability area), 0.8 - 1 (high-suitability area) (Li et al., 2020).

3. 결과 및 고찰

3.1 변수 및 최적 모델 선정

초기 모델 구동 및 변수 사이의 상관관계 분석을 통하여(Table 2) 최종 모델 구동을 위한 환경변수로 bio03, bio09, bio10, bio13, bio15 및 bio19가 최종 선정되었다(Table 3). bio03은 bio02, bio09는 bio01, bio04, bio04a, bio06, bio07 및 bio11, bio10은 bio05와 bio08, bio13은 bio12, bio16 및 bio18, bio19는 bio17과 높은 상관관계를 가지는 것으로 확인되었다(Table 2).

Table 2.

Pearson correlation coefficient of environmental variables

bio01 bio02 bio03 bio04 bio04a bio05 bio06 bio07 bio08 bio09 bio10 bio11 bio12 bio13 bio14 bio15 bio16 bio17 bio18 bio19
bio01 1.000 -0.559 -0.333 -0.762 -0.789 0.8496 0.954 -0.776 0.703 0.939 0.842 0.964 -0.002 -0.163 0.052 -0.436 -0.145 0.175 -0.266 0.250
bio02 1.000 1.000 0.923 0.698 0.698 -0.244 -0.629 0.673 -0.064 -0.652 -0.222 -0.634 -0.324 -0.164 -0.505 0.512 -0.159 -0.565 -0.008 -0.584
bio03 1.000 1.000 1.000 0.393 0.392 -0.159 -0.344 0.355 -0.008 -0.390 -0.136 -0.357 -0.363 -0.281 -0.463 0.285 -0.256 -0.528 -0.135 -0.541
bio04 1.000 1.000 1.000 1.000 0.999 -0.321 -0.9160.997 -0.103 -0.901 -0.297 -0.905 -0.202 0.048 -0.366 0.719 0.009 -0.443 0.176 -0.488
bio04a 1.000 1.000 1.000 1.000 1.000 -0.361 -0.9320.997 -0.145 -0.916 -0.337 -0.922 -0.188 0.060 -0.351 0.711 0.022 -0.430 0.187 -0.478
bio05 1.000 1.000 1.000 1.000 1.000 1.000 0.670 -0.341 0.920 0.674 0.995 0.690 -0.105 -0.145 -0.199 -0.077 -0.152 -0.039 -0.201 0.047
bio06 1.000 1.000 1.000 1.000 1.000 1.000 1.000 -0.926 0.479 0.984 0.652 0.999 0.077 -0.136 0.193 -0.599 -0.106 0.303 -0.253 0.370
bio07 1.000 1.000 1.000 1.000 1.000 1.000 1.000 1.000 -0.139 -0.904 -0.320 -0.914 -0.151 0.098 -0.345 0.720 0.058 -0.403 0.218 -0.444
bio08 1.000 1.000 1.000 1.000 1.000 1.000 1.000 1.000 1.000 0.449 0.945 0.503 -0.311 -0.277 -0.318 0.108 -0.289 -0.269 -0.264 -0.225
bio09 1.000 1.000 1.000 1.000 1.000 1.000 1.000 1.000 1.000 1.000 0.647 0.983 0.152 -0.059 0.257 -0.606 -0.037 0.399 -0.189 0.471
bio10 1.000 1.000 1.000 1.000 1.000 1.000 1.000 1.000 1.000 1.000 1.000 0.674 -0.157 -0.191 -0.220 -0.057 -0.195 -0.091 -0.235 -0.015
bio11 1.000 1.000 1.000 1.000 1.000 1.000 1.000 1.000 1.000 1.000 1.000 1.000 0.076 -0.132 0.182 -0.583 -0.104 0.294 -0.250 0.362
bio12 1.000 1.000 1.000 1.000 1.000 1.000 1.000 1.000 1.000 1.000 1.000 1.000 1.000 0.937 0.556 -0.146 0.960 0.783 0.888 0.827
bio13 1.000 1.000 1.000 1.000 1.000 1.000 1.000 1.000 1.000 1.000 1.000 1.000 1.000 1.000 0.370 0.190 0.991 0.608 0.969 0.664
bio14 1.000 1.000 1.000 1.000 1.000 1.000 1.000 1.000 1.000 1.000 1.000 1.000 1.000 1.000 1.000 -0.650 0.398 0.892 0.336 0.773
bio15 1.000 1.000 1.000 1.000 1.000 1.000 1.000 1.000 1.000 1.000 1.000 1.000 1.000 1.000 1.000 1.000 0.120 -0.576 0.246 -0.513
bio16 1.000 1.000 1.000 1.000 1.000 1.000 1.000 1.000 1.000 1.000 1.000 1.000 1.000 1.000 1.000 1.000 1.000 0.623 0.972 0.674
bio17 1.000 1.000 1.000 1.000 1.000 1.000 1.000 1.000 1.000 1.000 1.000 1.000 1.000 1.000 1.000 1.000 1.000 1.000 0.525 0.972
bio18 1.000 1.000 1.000 1.000 1.000 1.000 1.000 1.000 1.000 1.000 1.000 1.000 1.000 1.000 1.000 1.000 1.000 1.000 1.000 0.556
bio19 1.000 1.000 1.000 1.000 1.000 1.000 1.000 1.000 1.000 1.000 1.000 1.000 1.000 1.000 1.000 1.000 1.000 1.000 1.000 1.000

Values higher than 0.85 are set in bold face.

Table 3.

Relative importance of environmental variables in MaxEnt model

Environmental
variables
Percent
contribution (%)
Permutation
importance (%)
bio15 47.3 41.7
bio10 26.7 52.3
bio09 11.3 0
bio13 8.2 0.7
bio19 3.2 4.7
bio03 3.1 0.5

후보 모델 48개 중 최적의 모델로 L0.5가 선정되었다. 즉, feature class가 L(linear)이고 regularization multiplier 값이 0.5인 조합이 가장 낮은 AICc값을 나타냈다. 최종 선정된 L0.5 모델을 이용하여 미국쥐손이의 적합 서식지를 예측했다.

3.2 모델 평가

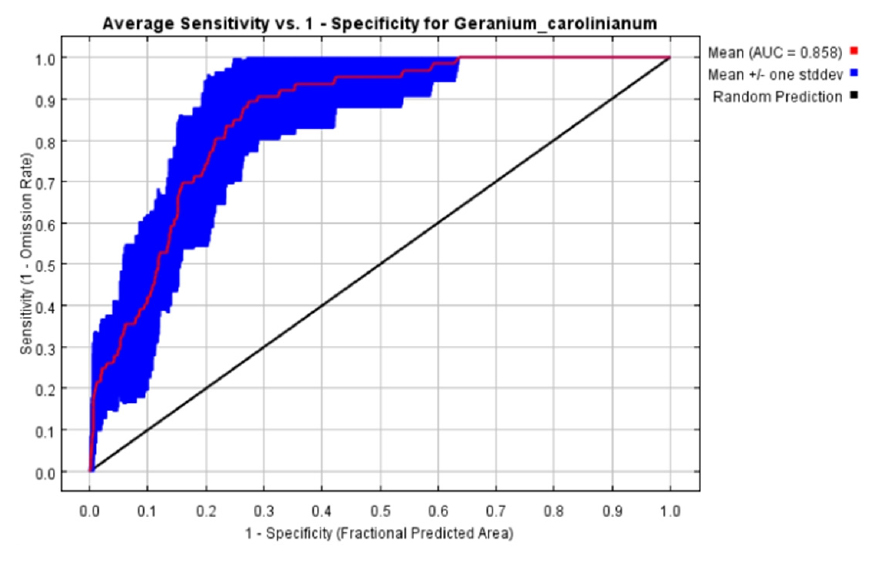
최종 선정된 L0.5 모델에 대한 10-fold cross-validation 결과, 평균 test AUC 값은 0.8 이상 (good)인 0.858로 계산됨으로써, 본 모델은 신뢰할 수 있고 적합한 성능을 가진 것으로 판단된다 (Fig. 3, Swets 1988).

https://static.apub.kr/journalsite/sites/kseie/2021-008-03/N0190080303/images/kseie_08_03_03_F3.jpg
Fig. 3

The ROC (receiver operating characteristic) curve and AUC (area under ROC curve) values by the MaxEnt model for G. carolinianum.

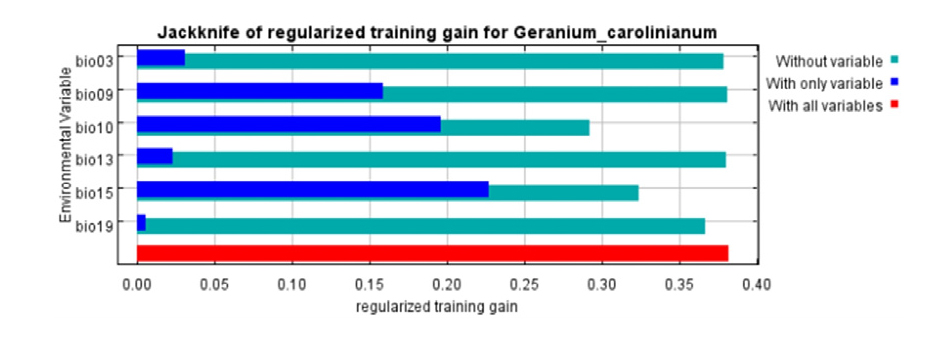
미국쥐손이의 분포에 높은 기여도(Percent contribution)와 중요도 (Permutation importance)를 나타내는 변수를 확인했다. 기여도는 bio15 (47.3%), bio10 (26.7%), bio09 (11.3%) 순으로 높게 나타났고, 중요도는 bio10 (52.3%)와 bio15 (41.7%)이 높게 나타났다 (Table 3). 이외의 나머지 환경변수들은 10% 이하의 기여도와 중요도 값을 나타냈다. Jackknife test에서도 bio15, bio10, bio09가 중요한 환경변수로 확인되었다 (Fig. 4).

https://static.apub.kr/journalsite/sites/kseie/2021-008-03/N0190080303/images/kseie_08_03_03_F4.jpg
Fig. 4

Importance of environmental variables to G. carolinianum by jackknife test.

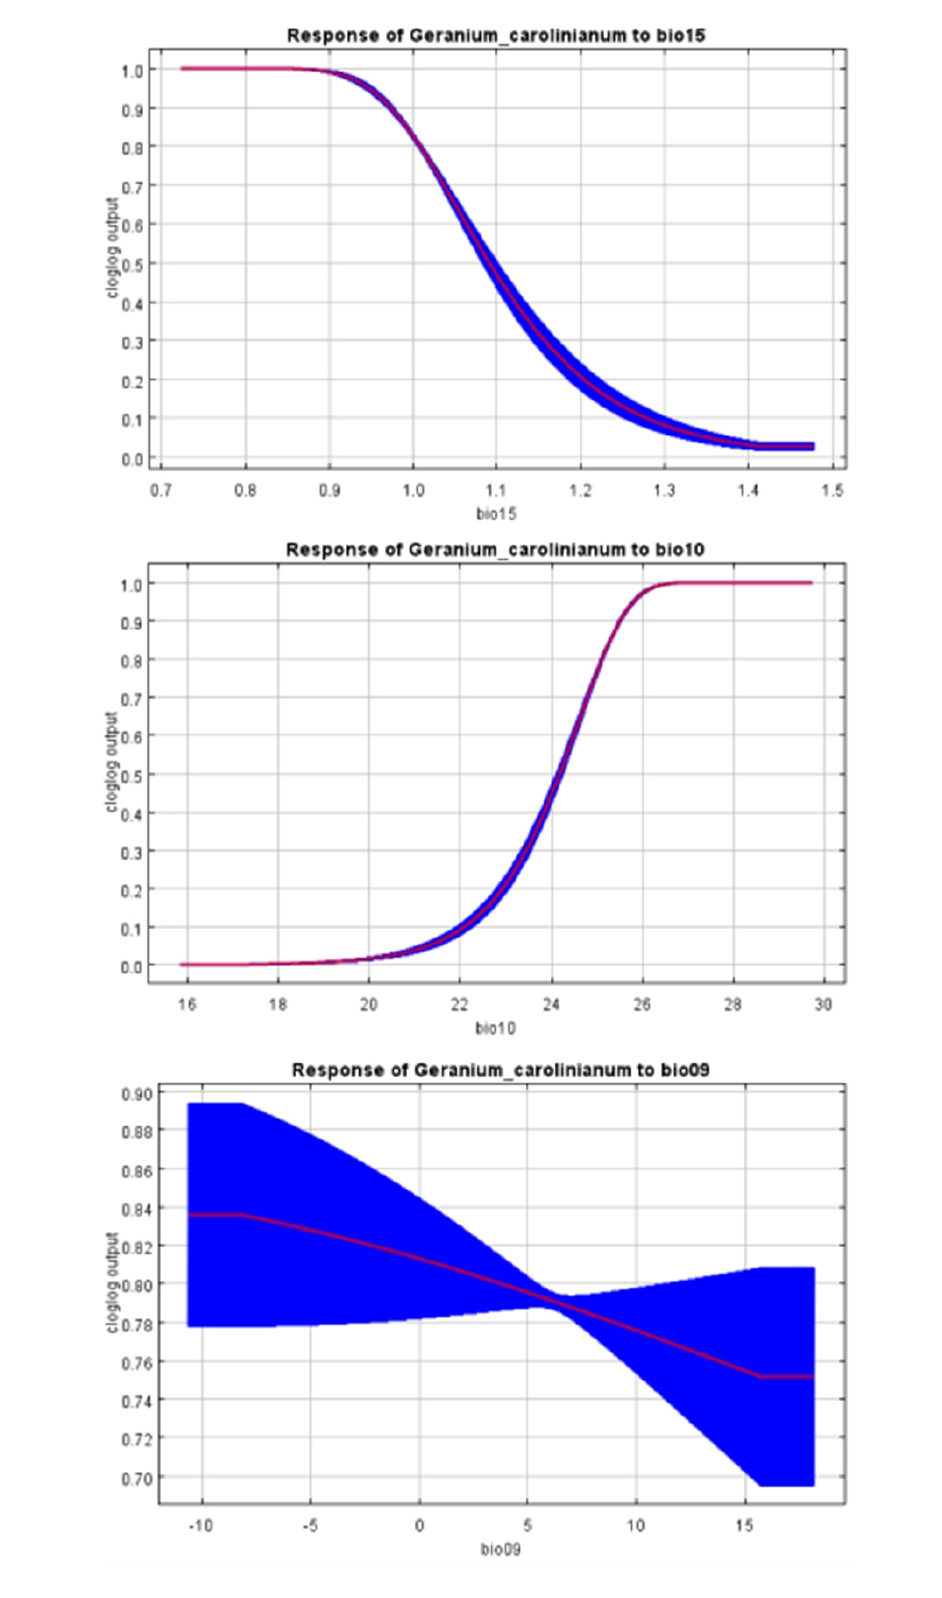
환경변수 중 미국쥐손이의 분포에 높은 기여도 (10% 이상)를 나타내는 bio15, bio10, bio09의 반응곡선을 확인한 결과, bio15와 bio09의 값이 증가할수록 존재 확률은 감소하는 경향을 나타냈다 (Fig. 5). 반면 bio10의 값이 증가할수록 존재 확률도 함께 증가하는 경향을 나타냈다. 각 변수별 50% 이상의 존재 확률을 나타내는 범위는 bio15는 1.1 이하, bio10은 24°C 이상, bio09는 전체 구간인 것으로 예측되었다.

https://static.apub.kr/journalsite/sites/kseie/2021-008-03/N0190080303/images/kseie_08_03_03_F5.jpg
Fig. 5

Response curve of the environmental variables contributing greater than 10% in G. carolinianum’s habitat distribution model. Red lines and blue lines are mean and standard deviation of ten replicated responses, respectively.

3.3 분포 적합지 예측

MaxEnt 모델을 통해 분석된 기준년대에서 미국쥐손이의 분포 확률이 높은 지역은 실제 출현한 지역과 유사하게 나타났다. 기준년대에서 일반 이상 (general, medium, high)의 서식지 적합성을 가진 지역은 제주도와 남해안 그리고 서해안을 따라서 충청남도까지 분포하는 것으로 나타났다 (Fig. 6). 기준년대에서 서식지 적합성 등급별 비율은 비적합지, 낮은 적합지, 일반 적합지, 중간 적합지, 높은 적합지는 각각 37.05%, 25.26%, 16.25%, 15.02% 및 6.43%로 비적합지가 높은 적합지보다 5.8배 높게 나타났다 (Table 4). 현재 우리나라 기후조건에서 미국쥐손이는 고도가 높은 산지와 위도가 높은 강원도와 경기도 동북부 지역에서는 서식하기에 적합하지 않은 것을 알 수 있다.

미국쥐손이의 적합 서식지에 대한 미래 변동성을 예측하기 위하여, 모델에 기준년대 대비 미래 기후변화 시나리오 SSP2-4.5와 SSP5-8.5를 투영하였다 (Table 4, Fig. 6). 그 결과, SSP2-4.5에서 미국쥐손이가 서식하기 어려운 비적합지 면적 비율은 기준년대 37.05%에서 근미래에 9.89%로 급격히 감소하고, 이후 중미래 3.41%, 먼미래 1.21%로 시간의 경과에 따라 지속적으로 감소하는 경향을 나타냈다. 낮은 적합지의 경우도 동일하게 감소하는 경향을 나타냈다. 반면에 높은 적합지 면적 비율은 기준년대 6.43%에서 근미래 43.12%, 중미래 79.83%, 먼미래 92.60%로 시간의 경과에 따라 급격히 증가하는 것으로 나타났다. SSP5-8.5에서 미국쥐손이가 서식하기 어려운 비적합지 면적 비율은 기준년대 37.05%에서 근미래에 8.40%, 중미래 1.50%, 먼미래 0.22%로 지속적으로 감소하는 것으로 나타났고, 이러한 감소 속도는 SSP2-4.5보다 빠른 것이다. 높은 적합지 면적 비율은 기준년대 6.43%에서 근미래 47.88%, 중미래 92.40%%, 먼미래 98.36%로 증가 속도는 SSP2-4.5보다 빨랐다. SSP2-4.5의 먼미래와 SSP5-8.5의 중미래에 미국쥐손이는 제주도 한라산의 고위도와 강원도 고지대 일부를 제외한 우리나라 면적의 90% 이상에서 높은 적합성을 나타냈다.

https://static.apub.kr/journalsite/sites/kseie/2021-008-03/N0190080303/images/kseie_08_03_03_F6.jpg
Fig. 6

Potential distribution of suitable area of G. carolinianum under climate change using SSP2-4.5 and SSP5-8.5 in South Korea. Historical period: 1981-2010; Near future: 2011-2040; Mid future: 2041-2070; Far future: 2071-2100.

Table 4.

The ratio of predicted area to total land area of South Korea for G. carolinianum under climate change using SSP2-4.5 and SSP5-8.5

Suitability Grade SSP
Historical
perioda)
SSP2-4.5 SSP5-8.5
Near futureb) Mid futurec) Far futured) Near future Mid future Far future
None (%) 37.05 9.89 3.41 1.21 8.40 1.50 0.22
Low (%) 25.26 13.68 3.21 2.10 10.30 2.04 0.19
General (%) 16.25 16.46 3.44 1.78 16.90 1.79 0.40
Medium (%) 15.02 16.85 10.11 2.31 16.51 2.27 0.84
High (%) 6.43 43.12 79.83 92.60 47.88 92.40 98.36

a)Historical period: 1981-2010; b)Near future: 2011-2040; c)Mid future: 2041-2070; d)Far future: 2071-2100.

미국쥐손이는 초원, 길가, 농경지, 휴경지 등 양분이 부족한 건조한 지역을 선호하기 때문에 (Horst 2013), 우리나라에서 미국쥐손이의 빠른 북상 및 서식지 범위 확장은 국내 자생식물 서식지에 상당한 영향을 줄 것이며, 궁극적으로 생물다양성을 감소시킬 수 있다(Levine et al. 2003, Vilà et al. 2011, Bradley et al. 2010a, Taylor et al. 2012). 또한 농경지 내로 침입 및 번성은 작물의 생산성 감소 등 농업 현장에서 큰 피해를 일으킬 수 있다 (Cousens and Mortimer 1995, Pimentel 2000). 향후 기후변화는 새로운 외래식물의 국내 도입 및 자연생태계에서 정착의 가능성을 높일뿐만 아니라 이들의 확산을 촉진시킬 수 있다 (Bradley et al. 2010b, Davidson et al. 2011). 따라서 미국쥐손이를 비롯하여 최근 새롭게 귀화한 식물의 현장 모니터링과 함께 이들의 분포 변화를 예측함으로써 향후 문제가 될 수 있는 귀화식물을 선발하고 사전에 이들의 확산을 방제할 수 있는 방안을 수립해야 할 것이다.

4. 결 론

최근 활발한 국제 교류와 기후변화 등의 원인으로 국내로 새롭게 유입되어 정착하는 귀화식물이 증가하고 있다. 이러한 귀화식물의 확산은 국내 생태계에 변화를 초래할 것이다. 본 연구에서는 상대적으로 최근에 귀화식물로 기록되었지만, 빠르게 확산하고 있는 미국쥐손이 (Geranium carolinianum)의 기준년대와 미래의 분포 적합지 예측을 MaxEnt 모델을 이용하여 수행했다. 미국쥐손이의 적합 서식지는 강수량 계절성 (bio15), 가장 따뜻한 분기의 평균기온 (bio10), 가장 건조한 분기의 평균기온 (bio09)의 환경변수가 크게 기여하는 것으로 나타났다. 환경변수 bio15와 bio09의 값이 증가할수록 미국쥐손이의 존재 확률은 감소하는 반면, bio10의 값이 증가할수록 존재 확률도 증가하는 경향을 나타냈다. 기준년대 (1981 - 2010)에서 미국쥐손이의 높은 서식지 적합성을 나타내는 지역은 제주도와 남해안 그리고 서해안의 남부지역을 중심으로 분포하지만, SSP2-4.5와 SSP5-8.5 시나리오에 따라 미래에는 그 분포 범위가 북쪽으로 확대되었다. 특히, 기후변화가 관리되지 않는 SSP5-8.5 시나리오 하에서는 중미래에 남한면적의 90% 이상을 차지하는 것으로 전망되었다. 향후 국가 간 교류가 더 증가하고 기후변화가 지속되면 외래식물의 유입도 증가할 것으로 판단된다. 국내 자연생태계의 생물다양성 관리뿐만 아니라 농업생태계에서 작물의 안정적인 생산을 위하여, 미국쥐손이를 포함한 귀화식물의 분포 변화를 모니터링하고 예측할 필요성이 있다.

Acknowledgements

본 연구는 농촌진흥청 공동연구사업(과제번호: PJ 01480801, PJ01480804)의 지원에 의해 이루어진 것임.

References

1
Aedo, C. 2000. The genus Geranium L. (Geraniaceae) in North America. I. Annual species. Anales del Jardín Botánico de Madrid 58: 39-82. 10.3989/ajbm.2000.v58.i1.138
2
Biber-Freudenberger, L., Ziemacki, J., Tonnang, H.E., and Borgemeister, C. 2016. Future risks of pest species under changing climatic conditions. Plos One 11(4): e0153237. 10.1371/journal.pone.015323727054718PMC4824351
3
Bradley, B.A., Blumenthal, D.M., Wilcove, D.S., and Ziska, L.H. 2010b. Predicting plant invasions in an era of global change. Trends in Ecology & Evolution 25(5): 310-318. 10.1016/j.tree.2009.12.00320097441
4
Bradley, B.A., Wilcove, D.S., and Oppenheimer, M. 2010a. Climate change increases risk of plant invasion in the Eastern United States. Biological Invasions 12(6): 1855-1872. 10.1007/s10530-009-9597-y
5
Cho, K.H. and Lee S.H. 2015. Prediction of changes in the potential distribution of a waterfront alien plant, Paspalum distichum var.indutum, under cliamte change in the Korean peninsula. Ecology and Resilient Infrastructure 2: 206-215. (in Korean) 10.17820/eri.2015.2.3.206
6
Cho, N.H., Kim, E.S., Lee, B., Lim, J.H., and Kang, S.K. 2020. Predicting the potential distribution of Pinus densiflora and analyzing the relationship with environmental variable using MaxEnt model. Korean Journal of Agricultural and Fores Meteorology 22(2): 47-56. (in Korean)
7
Cleland, E.E., Chuine, I., Menzel, A., Mooney, H.A., and Schwartz, M. D. 2007. Shifting plant phenology in response to global change. Trends in Ecology & Evolution 22(7): 357-365. 10.1016/j.tree.2007.04.003
8
Cousens, R.D., and Mortimer, M. 1995. Dynamics of weed populations. Cambridge University Press, Cambridge. 10.1017/CBO9780511608629
9
Davidson, A.M., Jennions, M., and Nicotra, A.B. 2011. Do invasive species show higher phenotypic plasticity than native species and, if so, is it adaptive? A meta-analysis. Ecological Letters 14: 419-431. 10.1111/j.1461-0248.2011.01596.x21314880
10
Dormann, C.F., Elith, J., Bacher, S., Buchmann, C., Carl, G., Carré, G., Marquéz, J.R., Gruber, B., Lafourcade, B., Leitão, P.J., Münkemüller, T., McClean, C., Osborne, P.E., Reineking, B., Schröder, B., Skidmore, A.K., Zurell, D., and Lautenbach, S. 2013. Collinearity: a review of methods to deal with it and a simulation study evaluating their performance. Ecography 36(1): 27-46. 10.1111/j.1600-0587.2012.07348.x
11
Elith, J., Graham, C.H., Anderson, R.P., et al. 2006. Novel methods improve prediction of species' distributions from occurrence data. Ecography 29(2): 129-151. 10.1111/j.2006.0906-7590.04596.x
12
Elith, J., Kearney, M., and Phillips, S. 2010. The art of modelling range-shifting species. Methods in Ecology and Evolution 1: 330-342. 10.1111/j.2041-210X.2010.00036.x
13
Elith, J. and Leathwick, J.R. 2009. Species distribution models: Ecological explenation and prediction across space and time. Annual Review of Ecology Evolution & Systematics 40(1): 677-697. 10.1146/annurev.ecolsys.110308.120159
14
Fang, Y., Zhang, X., WEi, H., Wang, D., Chen, R., Wang, L., and Gu, W. 2021. Predicting the invasivie trend of exotic plants in China based on the ensemble model under climate change: A case for three invasive plants of Asteraceae. Science of The Total Environment 756: 143841. 10.1016/j.scitotenv.2020.14384133248784
15
Foden, W., Mace, G., Vié, J.-C., Angulo, A., Butchart, S., DeVantier, L., Dublin, H., Gutsche, A., Stuart, S., and Turak, E. 2008. Species susceptibility to climate change impacts. The 2008 Review of the IUCN Red List of Threatened Species. J.C. Vie, C. Hilton-Taylor and S.N. Stuart eds. Switzerland. IUCN Gland.
16
Gama-Arachchige, N.S., Baskin, J.M., Geneve, R.L., and Baskin, C.C. 2011. Acquisition of physical dormancy and ontogeny of the micropyle-water-gap complex in developing seeds of Geranium carolinianum (Geraniaceae). Annals of Botany 108: 51-64. 10.1093/aob/mcr10321546433PMC3119614
17
Gill, N.S., and Sangermano, F. 2016. Africanized honeybee habitat suitability: a comparison between models for southern Utah and southern California. Applied Geography 76: 14-21. 10.1016/j.apgeog.2016.09.002
18
Hegland, S.J., Nielsen, A., Lázaro, A., Bjerknes, A.-L., and Totland, Ø. 2009. How does climate warming affect plant-pollinator interaction? Ecological Letters 12: 184-195. 10.1111/j.1461-0248.2008.01269.x19049509
19
Heikkinen, R.K., Luoto, M., Araujo, M.B., Virkkala, R., Thuiller, W. and Sykes, M. T. 2006. Methods and uncertainties in bioclimatic envelope modelling under climate change. Progress in Physical Geography 30: 751- 777. 10.1177/0309133306071957
20
Hejda, M., Pyšek, P., and Jarošik, V. 2009. Impacat of invasive plants on the species richness, diversity and composition of invaded communities. Journal of Ecology 97: 393-403. 10.1111/j.1365-2745.2009.01480.x
21
Hellmann, J.J., Byers, J.E., Bierwagen, B.G., and Dukes, J.S. 2008. Five potential consequences of climate change for invasive species. Conservation Biology 22: 534-543. 10.1111/j.1523-1739.2008.00951.x18577082
22
Hernandez, P.A., Graham, C.H., Master, L.L., and Albert, D.L. 2006. The effect of sample size and species characteristics on performance of different species distribution modeling methods. Ecography 5: 773-785. 10.1111/j.0906-7590.2006.04700.x
23
Hors,t R.K. 2008. Westcott's Plant Disease Handbook, Springer Netherlands. p. 783.
24
Hijiman, R.J., van Etten, J., Cheng, J., Mattiuzzi, M., Summer, M., Greenberg, J.A., and Ghosh, A. 2017. The raster Package: Geographic data analysis and modeling, version 2.6-7.
25
Hoveka, L.N., Bezeng, B.S., Yessoufou, K., Boatwright, J.S., Van der Bank, M. 2016. Effects of climate change on the future distributions of the top five freshwater invasive plants in South Africa. South African Journal of Botany 102:33-38. 10.1016/j.sajb.2015.07.017
26
Hu, J., and Jiang, Z. 2011. Climate change hastens the conservation urgency of an endangered ungulate. PLoS ONE 6(8): e22873. 10.1371/journal.pone.002287321826214PMC3149626
27
Jeon, E.S. 1995. Recently naturalized Geranium carolinianum L. and Trifolium dubium Sibth. Bulletin of Korea Plant Conservation Society 34:22-23. (in Korean)
28
Jo, W.S., Kim, H.Y., and Kim, B.J. 2017. Climate change alters diffusion of forest pest:A model study. Journal of the Korean Physical Society 70(1): 108-115. 10.3938/jkps.70.108
29
Kramer-Schadt, S., Niedballa, J., Pilgrim, J.D., Schröder, B., Lindenborn, J., Reinfelder, V., Stillfried, M., Heckmann, I., Scharf, A.K., Augeri, D.M., Cheyne, S.M., Hearn, A.J., Ross, J., Macdonald, D.W., Mathai, J., Eaton, J., Marshall, A.J., Semiadi, G., Rustam, R., Bernard, H., Alfred, R., Samejima, H., Duckworth, J.W., Breitenmoser-Wuersten, C., Belant, J.L., Hofer, H., and Wilting, A. 2013. The importance of correcting for sampling bias in MaxEnt species distribution models. Diversity and Distribution 19: 1366-1379. 10.1111/ddi.12096
30
Lee, Y.H., Hong, S.H., Na, C.S., Sohn, S.I., Kim, M.H., Kim, C.S., Oh, Y.J. 2016. Predicting the suitable habitat of Amaranthus viridis based on climate change scenarios by MaxEnt. Korean Journal of Environmental Biology 34(4): 240-245. (in Korean) 10.11626/KJEB.2016.34.4.240
31
Lee, Y.M., Park, S.H., Jung, S.Y., Oh, S.H., and Yang, J.C. 2011. Study on the current status of naturalized plants in South Korea. Korean Journal of Plant Taxonomy 41(1): 87-101. (in Korean) 10.11110/kjpt.2011.41.1.087
32
Li, Y., Li, M., Li, C., and Liu, Z. 2020. Optimized maxent model predictions of climate change impacts on the suitable distribution of Cunninghamia lanceolata in China. Forests 11(3). 10.3390/f11030302
33
Liu, X., Zong, T., Li, Y., Zhou, X., and Bai, L. 2018. Effect of environmental factors on seed germination and early seedling emergence of Carolina geranium (Geranium carolinianum). Planta Daninha 36:e018181055. 10.1590/s0100-83582018360100136
34
Morales, N.S., Fernandez, I.C., and Baca‐Gonzalez, V. 2017. MaxEnt's parameter configuration and small samples: Are we paying attention to recommendations? A systematic review. PeerJ 5: e3093. 10.7717/peerj.309328316894PMC5354112
35
Nam, H.K., Song, Y.J., Kwon, S.I., Eo, J., and Kim, M.H. 2018. Potential changes in the distribution of seven agricultural indicator plant species in response to climate change at agroecosystem in South Korea. Korean Journal of Ecology and Environment 51: 221-233. (in Korean) 10.11614/KSL.2018.51.3.221
36
Ortega-Huerta M.A., and Peterson, A.T. 2008. Modeling ecological niches and predicting geographic distributions: a test of six presence-only methods. Revista Mexicana de Biodiversidad 79: 205-2016.
37
Park, S.H. 2001. Colored illustrations of naturalized plants of Korea (Appendix). Ilchokak, Seoul, 178pp. (in Korean)
38
Person, R.G., Raxworthy, C.J., Nakamura, M., and Peterson, A.T. 2007. Predicting species distributions from small numbers of occurrence records: a test case using cryptic geckos in Madagascar. Journal of Biogeography 34: 102-117. 10.1111/j.1365-2699.2006.01594.x
39
Phillips, S.J., Anderson, R.P., and Schapire, R.E. 2006. Maximum entropy modeling of species geographic distributions. Ecological Modelling 190: 231-259. 10.1016/j.ecolmodel.2005.03.026
40
Pimental, D., Lach, L., Zuniga, R., and Morrison, D. 2000. Environmental and economic costs associated with non-indigenous species in the United States. Bioscience 50: 53-64. 10.1641/0006-3568(2000)050[0053:EAECON]2.3.CO;2
41
Rockwell-Postel, M., Laginhas, B.B., and Bradley, B.A. 2020. Supporting proactive management in the context of climate change: prioritizing range-shifting invasive plants based on impact. Biological Invasions 22: 2371-2383. 10.1007/s10530-020-02261-1
42
Sambaraja, K.R., Carroll, A.L. Zhu, J., Stahl, K., Moore, R.D., and Aukema, B.H. 2012. Climate change could alter the distribution of mountain pine beetle outbreaks in western Canada. Ecography 3: 211-223. 10.1111/j.1600-0587.2011.06847.x
43
Sharpe, S.M. and Boyd, N.S. 2020. Evaluation of sulfonylurea chemistries for strawberry crop safety and Carolina geranium (Geranium carolinianum) efficacy. Weed Technology 34: 214-219. 10.1017/wet.2019.100
44
Swets, J. 1988. Measuring the accuracy of diagnostic systems. Science 240: 1285-1293. 10.1126/science.32876153287615
45
Vilà, M., Espinar, J.L., Hejda, M., Hulme, P.E., Jarošík, V., Maron, J.L., Pergl, J., Schaffner, U., Sun, Y., and Pyšek, P. 2011. Ecological impacts of invasive alien plants: a meta-analysis of their effects on species, communities and ecosystems. Ecology Letters 14: 702-708. 10.1111/j.1461-0248.2011.01628.x21592274
46
Wilting, A., Cord, A., Hearn, A. J., Hesse, D., Mohamed, A., Traeholdt, C., Cheyne, S.M., Sunarto, S., Jayasilan, M.-A., Ross, J., Shapiro, A.C., Sebastian, A., Dech, S., Breitenmoser, C., Sanderson, J., Duckworth, J.W., and Hofer, H. 2010. Modelling the species distribution of flat-headed cats (Prionailurus planiceps), an endangered South-East Asian small felid. PLoS ONE 5: e9612. 10.1371/journal.pone.000961220305809PMC2840020
페이지 상단으로 이동하기