

1. 서 론
2. 연구 방법
2.1 연구대상지역
2.2 흐름 모형
2.3 물리서식처 분석
2.3.1 서식처적합도지수 곡선 수립
2.3.2 복합서식처 적합도 지수
3. 모의결과
3.1 흐름모의 결과
3.2 복합 서식처 적합도 지수
4. 결 론
1. 서 론
하천에서의 환경생태유량 산정방법 중 대중적으로 사용되는 방법 중의 하나인 유지유량증분법 (IFIM: Instream Flow Incremental Methodology)은 유량을 증가시켜감에 따라 대상 어종의 생애주기별 가용 서식처를 모의하여 최적의 유량을 찾아내는 방법이다. 이 방법은 물리서식처모의시스템 (PHABSIM: Physical habitat Simulation system)이라는 부프로그램을 사용하며 여기서 사용하는 방법인 물리서식처 모의는 흐름모의를 통하여 얻은 수심, 유속, 기층 등의 인자들의 적합도를 정량적으로 평가하는 방법이다. 물리서식처 분석은 많은 하천관리 결정사항에 적용되어왔다. 그 예로 생태유량산정 (Papadaki et al., 2014; Nikgahalb et al., 2016), 댐 운영 시나리오 (Zhang et al., 2016; Wen et al., 2016), 댐 및 보 철거의 영향 (Gillenwater et al., 2006; Tomsic et al., 2007; Im et al., 2011), 자연형 하도복원 (Gard, 2006), 인공적인 소-여울 구조의 설치 (Schwartz and Herricks, 2007) 등을 들 수 있다. 선행 연구들은 물리서식처 분석의 적용 대상으로 주로 어종을 선정하였으며 저서무척추 동물을 고려한 연구는 흔치 않다. 저서무척추 동물의 경우 어류와 마찬가지로 수리학적인 인자에 큰 영향을 받는다. 많은 선행연구들이 저서무척추 동물의 풍부도와 프루드 수, 전단 속도, 수심, 유속, 기층 등의 수리학적인 인자들과의 관계를 밝혀왔다 (Culp et al., 1983; Stark, 1993; Brooks et al., 2005; Duan et al., 2008). 또한 저서무척추 동물 종에 대한 서식처 적합도 지수 및 관계식을 제시하고 있다 (Gore and Judy, 1981; Jowett et al., 1991; Horta et al., 2009). 하지만 저서무척추 동물을 고려한 물리서식처 분석은 충분하게 이루어 지지 않고 있으며, 국내의 경우 가용 할만한 서식처 적합도 지수의 곡선은 제시되지 않은 상황이다.
저서무척추 동물은 육안으로 식별이 가능하고 척추가 없으며 하천 및 호수의 저서에 서식하는 동물을 총칭한다. 저서무척추 동물은 하천에서의 먹이사슬구조의 큰 부분을 담당하고 있으며 어류의 생산성과 밀접한 관련이 있다. 여울에서의 저서무척추 동물의 발생량은 작은 하천에서의 어류의 섭식환경에 있어 크게 중요하다 (Lewis et al., 2004). 또한 저서무척추 동물은 짧은 생애주기와 이동성이 적기 때문에 하천의 건강성을 보여주는 중요한 지표로 널리 활용되고 있다 (Agouridis et al., 2015).
이와 같이 저서무척추 동물 역시 어류 못지 않은 중요도를 가짐에도 불구하고 많은 선행 연구들이 어류를 중심으로 물리서식처 분석을 실시하여 왔다. 본 연구의 목적은 저서무척추 동물과 어류를 대상으로 물리서식처 분석을 실시하고 이를 분석하는 것이다. 이를 위하여 한강권역에서 모니터링된 자료를 이용하여 저서무척추 동물 및 어류에 대한 서식처 적합도 지수를 수립하였다. 연구대상 하천은 한강의 지류인 공릉천의 약 800 m 구간이다. 2차원 흐름모형을 이용한 수리해석을 실시하였으며, 서식처 적합도 지수 곡선을 이용하여 복합서식처 적합도 지수를 모의하였다.
2. 연구 방법
2.1 연구대상지역
연구대상지역은 한강의 지류인 공릉천의 약 0.8 km 구간이다 (Fig. 1). 공릉천은 한강의 제 1지류이며, 유로연장은 45 km, 유역면적은 253.1 km2이다. 연구대상지역의 갈수량 (Q355), 저수량 (Q275), 평수량 (Q185), 풍수량 (Q95)은 각각 0.28, 0.51, 0.91, 그리고 1.73 m3/s 이다. 연구대상지역에서의 하상재료의 분포는 Figure 2와 같으며 물리서식처 분석에 적용되었다.


연구대상지역에서는 어류 및 저서무척추 동물의 현장모니터링을 실시하였으며, 2006년 6월 현장모니터링 실시결과 어류의 경우 밀어 (Rhinogobius brunneus), 피라미 (Zacco platypus), 모래무지 (Pseudogobio esocinus), 왜매치 (Abbottina springeri)가 각각 48 %, 18%, 14 %, 그리고 10 %로 분포하였다. 저서무척추 동물의 종은 개체수를 기준으로 줄날도래 (Hydropsyche kozhantschikovi), 깔다구류 (Chironomidae), 개똥하루살이 (Baetis fuscatus), 꼬마줄날도래 (Cheumatopsyche brevilineata)가 각각 33%, 17%, 16%, 그리고 14%로 분포하였다. 본 연구에서는 해당 연구대상지역의 우점종과 아우점종을 대상으로 물리서식처 분석을 실시하였으며, 어류의 경우 밀어와 피라미, 저서무척추 동물의 경우 줄날도래와 깔다구류를 대상 종으로 선정하였다.
2.2 흐름 모형
본 연구에 사용된 흐름모형은 2차원 수심평균된 유속분포를 모의할 수 있는 River2D 모형이다 (Steffler and Blackburn, 2002). 지배방정식은 연속방정식과 운동량 방정식으로 이루어지며 각각 다음과 같다
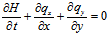 (1)
(1)
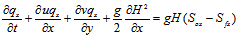
 (2)
(2)
 (3)
(3)
여기서  는 시간,
는 시간,  ,
,  는 각각 흐름방향과 횡방향 좌표, H는 수심,
  ,
,  는 각각
는 각각  ,
,  방향의 수심평균된 유속,
  ,
,  는 각각
는 각각  ,
,  방향 단위 폭 당 유량, Sox, Soy는 각각
  ,
,  방향 하상경사, Sfx, Sfy는 각각
  ,
,  방향 마찰경사이며 다음과 같다.
 ,
, 
(4a, 4b)
여기서  은 조도계수이다. 본 연구에서는 조도계수 값으로 0.033을 사용하였다 (Ministry Of Construction and Transportation, 2002). River2D는 비정렬 삼각형 격자를 사용하며 유한요소법을 이용하여 수치해를 구한다. 본 연구에서 구축된 지형고는 Figure 3과 같다. 모의 구간의 상류는 하상고의 변동이 크지 않으며, 중앙에 하상고가 낮아지는 지점이 존재한다. 그 후 하상고가 다시 상승하였다가 하류쪽으로 갈수록 하상고가 낮아지는 것을 확인할 수 있다. 여울과 소가 반복하여 나타나는 하도 형상을 확인할 수 있다.

2.3 물리서식처 분석
2.3.1 서식처적합도지수 곡선 수립
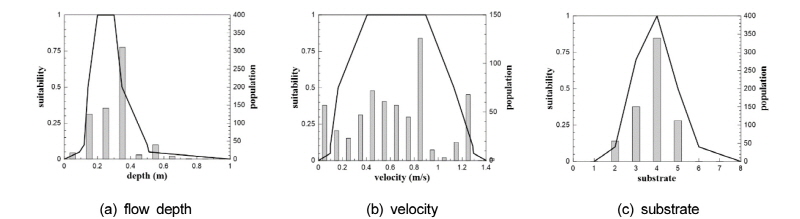
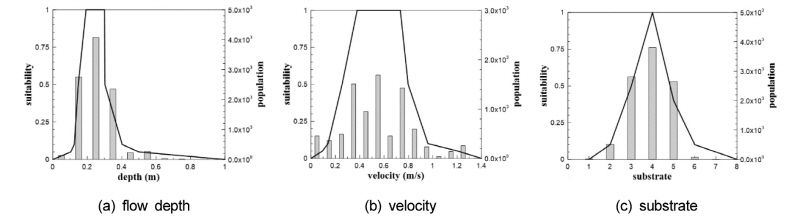
서식처 적합도 지수 곡선의 수립은 Gosse (1982)의 방법을 이용하였다. 이 방법은 모니터링된 데이터들의 분포가 상위 50%, 75%, 90%, 그리고 95%의 구간에 해당하는 값에 각각 1.0, 0.5, 0.1, 그리고 0.05의 값을 부여하는 방법이다. 서식처 적합도 곡선의 수립을 위해 사용된 데이터는 2010년 수생태계 건강성 조사 및 평가사업에서 구축된 데이터이다. 이 데이터는 한강 권역의 340지점의 모니터링 지점에서 각각 기온, 수온, 탁도, 수심, 유속, 기층이 기록되었고 개체수 및 개체군 밀도가 조사되었다. Figure 4와 5는 대상 저서무척추 동물 종과 어류의 수심, 유속, 기층 조건 별 분포도를 보여준다. 기층의 경우 각 지점에서의 실트, 모래, 잔자갈, 굵은자갈, 호박돌, 전석의 비율이 조사되었다. 이 분포들은 Eq. (5)을 이용하여 Substrate Index으로 변환되어 하나의 값으로 표현되었다 (Jowett et al., 1991).
Substrate Index = 0.01 clay% + 0.02 silt% + 0.03 sand%+ 0.04 fine gravel% + 0.05 coarse gravel%+ 0.06 cobble% + 0.07 boulder% + 0.08 bedrock%
(5)
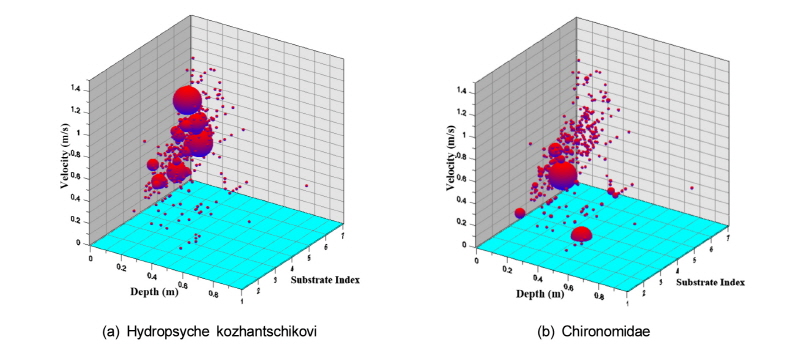
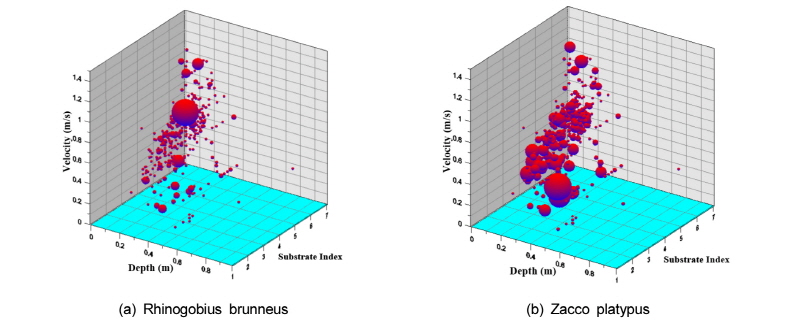
Figure 6과 7은 줄날도래와 깔따구류에 대한 서식처 적합도 지수 곡선이다. 줄날도래의 경우 수심이 0.19 m - 0.26 m의 범위 에서, 유속이 0.50 m/s - 0.79 m/s의 범위에서, 기층의 경우 잔 자갈에서 최적의 적합도를 보인다. 깔따구류의 경우 수심이 0.15 m - 0.30 m, 유속이 0.38 m/s - 0.70 m/s, 기층이 모래인 조건에서 최적의 적합도를 보임을 확인할 수 있다. 수심에 대한 적합도는 유속보다 좁은 범위에 분포함을 확인할 수 있다. 바 그래프는 해당 범위 내에서 분포하는 개체수의 밀도를 나타낸다. 수심은 유속보다 상대적으로 좁은 범위에서 분포하고 있음을 확인할 수 있으며 그 결과로 인하여 적합한 서식처의 조건은 수심이 유속보다 좁은 범위를 가지게 되었다. 줄날도래가 깔따구류보다 얕은 수심과 빠른 유속을 선호하는 것으로 나타났으며 줄날도래가 깔따구류보다 유수역에서 더 적합한 서식처를 갖는 것으로 볼 수 있다.
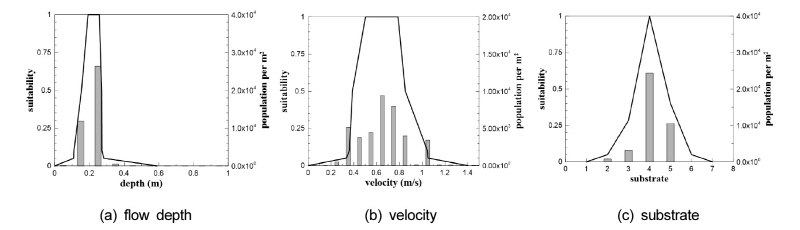
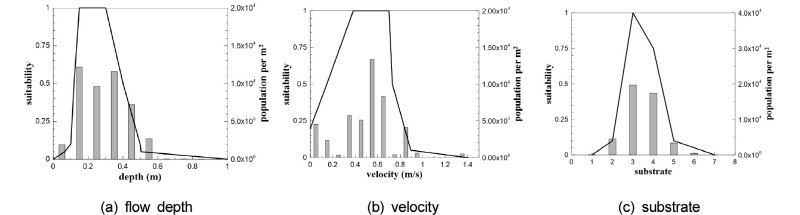
Figure 8과 9는 밀어와 피라미에 대한 서식처 적합도 지수 곡선 및 개체수의 분포를 보여준다. 밀어와 피라미는 수심에 대한 적합도는 비슷하며, 유속의 경우 밀어가 더 높은 조건에서 적응성을 가지는 것으로 확인된다. 기층의 경우 밀어와 피라미 모두 잔자갈 조건에서 가장 높은 서식처를 가지는 것을 확인할 수 있다.
2.3.2 복합서식처 적합도 지수
저서무척추 동물의 경우 수심, 유속, 기층의 인자 중 기층의 조건에 가장 큰 영향을 받는것으로 알려져 있다 (Jowett and Richardson, 1990; Quinn and Hickey, 1990; Jowett et al., 1991; Beisel et al., 1998; Brooks et al., 2005). Li et al. (2009)은 계층분석법 (AHP: Analytic Hierarchy Process)을 이용하여 저서무척추 동물의 복합서식처 적합도 지수 (CSI: Composite Suitability Index) 계산에 가중치를 부여하였다. 복합서식처 적합도 지수의 계산은 흐름모의의 계산결과를 이용하며 각 계산격자에서의 값을 산정한다. 본 연구에서는 가중치법을 이용하였으며 Eq. (6)와 같다.
 (6)
(6)
여기서  ,
,  ,
,  는 각각 수심, 유속, 기층에 대한 서식처 적합도 값이며,
  ,
,  ,
,  는 각각 가중치값이다. 본 연구에선 저서무척추 동물에 대하여
  =0.260,
  =0.327,
  =0.413의 가중치를 부여하였다 (Li et al., 2009). 어류의 경우 거의 모든 선행연구에서 동일한 가중치를 간주하여 복합 서식처 계산을 수행해왔다. 어류에 대한 가중치의 산정 사례는 희귀하며, 산정된 가중치의 적용 및 검증이 이루어지지 않는 상황이므로 본 연구에서는 동일한 가중치를 가정하였다 (
 =
= =
= =1/3).
3. 모의결과
3.1 흐름모의 결과
Figure 10은 평수량 조건에서의 흐름 모의 결과를 보여준다. 모의 구간의 흐름분석 결과 하천의 지형학적인 특성이 잘 반영된 흐름을 보여주며 소-여울의 구조가 번갈아가며 발생한 것을 보여준다. 여울의 경우 수심은 0.2 m - 0.3 m 사이에 분포하며 유속은 0.6 m/s - 0.8 m/s 의 분포를 가진다. 소의 경우 연구대상구간 중앙에서 최대 약 1 m의 깊이의 수심을 가지며 유속은 0.1 m/s - 0.2 m/s의 분포를 가지는 것을 확인할 수 있다.
3.2 복합 서식처 적합도 지수
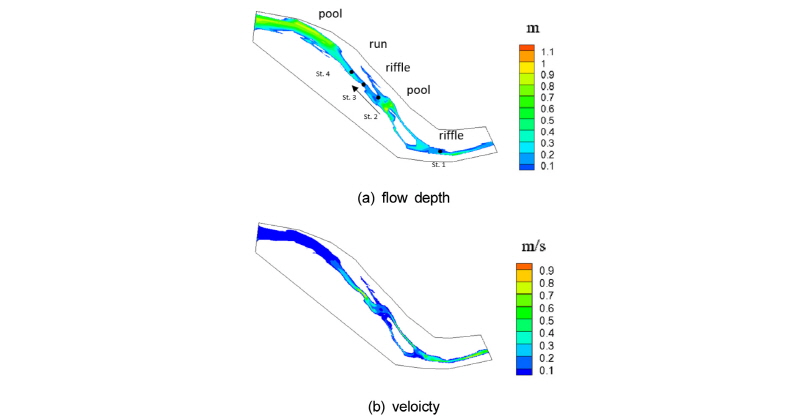
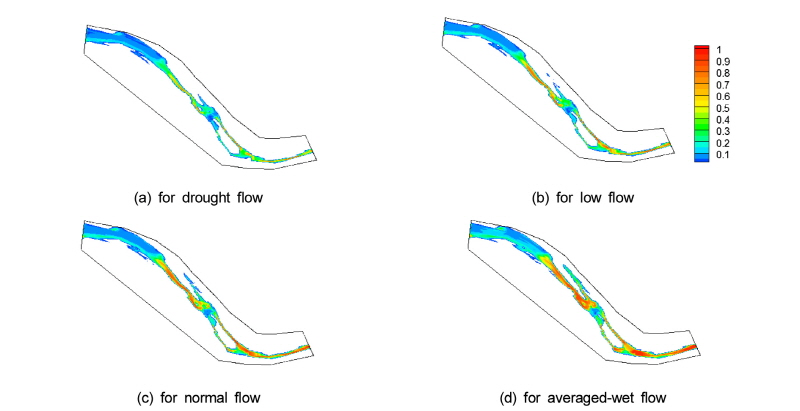
Figure 11은 줄날도래의 복합 서식처 적합도 지수의 분포를 보여준다. 줄날도래의 복합 서식처 적합도 지수는 모의대상구간의 여울이 위치하는 곳에서 높은 값을 나타낸다. 또한 갈수량에서 풍수량으로 갈수록 복합서식처가 좋아지는 결과를 보였다. 여울의 경우 잔 자갈 및 굵은 자갈의 비율이 50% 이상을 차지하며, 수심이 낮고, 빠른 유속이 복합 서식처 적합도 지수를 크게 산정하는 결과를 보인다. Figure 12는 깔따구류의 복합 서식처 적합도 지수의 분포를 보여준다. 깔따구류의 경우 소의 시작과 끝 지점에서 높은 서식처를 보인다. 소에서의 중앙부분은 수심이 깊어짐에 따라 서식처의 값이 작아지게 되었다.
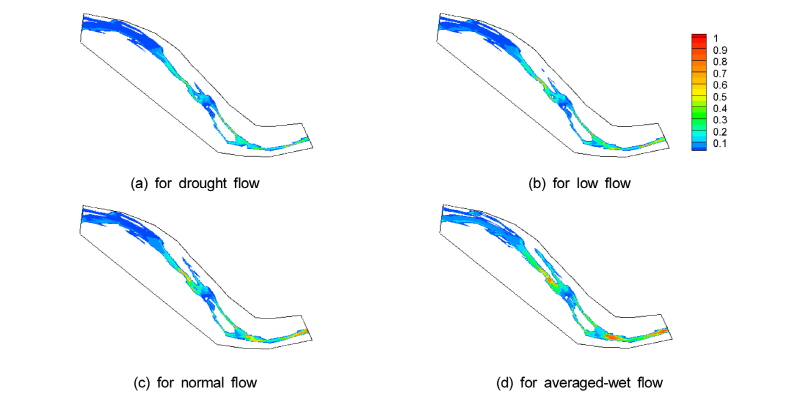
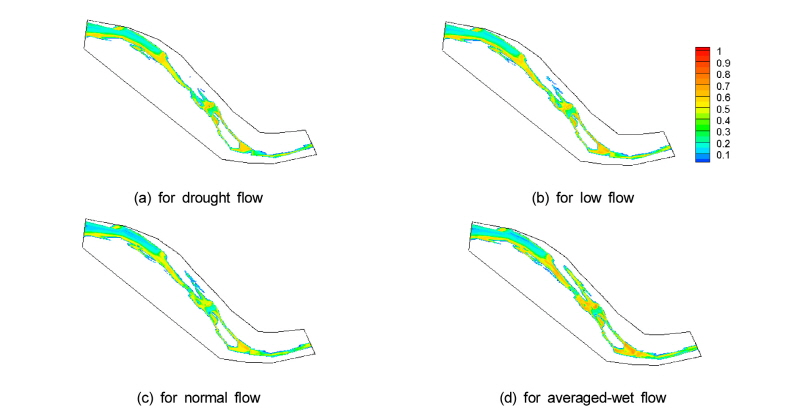
Figure 9(a)에서의 St.1-St.4는 저서무척추 동물의 현장조사가 이루어진지점이다. 2006년 6월의 경우 저서무척추 동물의 모니터링 결과에 의하면 St.1, St.3, St.4에서의 우점종은 줄날도래, St.2에서의 우점종은 깔따구류로 조사되었다 (KICT, 2008). 이는 줄날도래는 여울에서 깔따구류는 소의 서식처를 선호한다고 볼 수 있으며 모의 결과는 이 경향을 타당하게 모의하고 있음을 확인할 수 있다.
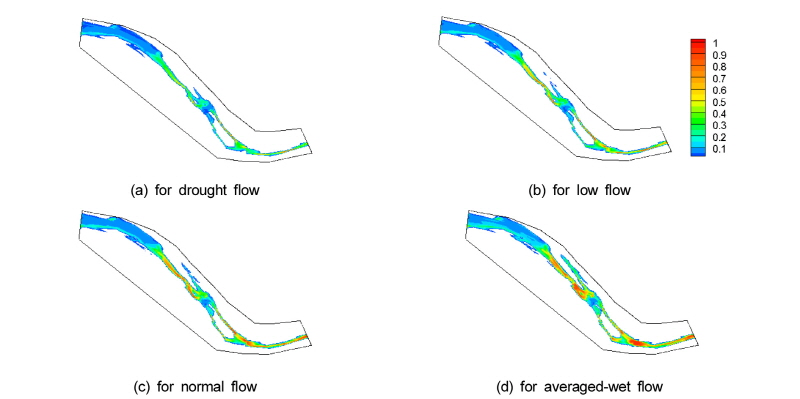
Figure 13과 14는 각각 유량에 따른 밀어와 피라미의 복합 서식처 적합도 지수의 분포를 보여준다. 밀어와 피라미 모두 유량이 증가할수록 적합한 서식처의 분포가 증가하는 것을 확인할 수 있으며, 여울이 위치한 곳에서 높은 서식처가 모의되었다. 밀어와 피라미의 경우 유수성 어종이며 여울에서의 서식처를 선호하는 경향이 모의되었다고 판단된다.
4. 결 론
본 연구는 어류와 저서무척추 동물의 서식처 적합도 지수곡선을 제시하고 공릉천을 대상으로 물리서식처 분석을 실시하였다. 저서무척추 동물은 줄날도래와 깔따구류를 대상 종으로 선정하였고 어류의 경우 밀어와 피라미를 대상어종으로 선정하였다. 줄날도래의 경우 하천의 상류부터 하류에 이르기까지 서식범위가 넓으며, 특히 유기물이 풍부한 중류 규모의 하천에서 많이 출현한다. 또한 자갈로 이루어진 유속이 빠른 여울에 서식하는 것으로 알려져 있다 (Kwon et al., 2013). 깔따구류의 경우 유수역과 정수역의 모든 물환경에 잘 적응한다고 알려져 있다. 본 모의 결과 줄날도래는 여울에서 깔따구류는 소의 시작과 끝에서 높은 서식처를 보였다. 깔따구류의 서식처 적합도 지수는 유속이 낮은곳에서도 높은 적합도를 가졌으며 모래에서 가장 큰 적합도를 가졌다. 이와 같은 조건이 여울에서의 서식처를 상대적으로 낮게 평가하였다. 어류의 경우 밀어와 피라미를 대상으로 물리서식처 분석을 실시하였다. 밀어와 피라미 모두 여울에서 높은 서식처를 보이며, 유속이 빠른 지역을 선호하는 유수성 어종의 특징을 잘 보여주고 있다. 본 모의 결과를 토대로 밀어와 피라미는 깔따구류보다 줄날도래종에 대하여 섭식하기 좋은 조건임을 확인할 수 있다. 본 연구는 저서무척추 동물 종의 서식환경이 다양할 수 있음을 보여주고 있으며, 어류에 초점이 맞추어진 물리서식처 분석은 저서무척추 동물의 서식환경을 고려하지 못할 수 있다는 한계점을 보여준다. 이는 곧 어류의 섭식환경과 연관되어 부가적인 어류서식처의 저감을 초래할 수 있다. 어류와 저서무척추 동물을 고려한 평가는 어류의 서식 및 섭식의 균형을 고려한 분석을 수행할 수 있으며 수생태계의 통합적인 관리 측면에서 권장될 필요가 있다.
