

1. Introduction
2. Materials and Methods
2.1 Study area and dataset
2.2 Method
3. Result and Discussion
3.1 Multiple linear regression model
3.2 Estimation of river pollution index
4. Conclusion
1. Introduction
River water is considered as a main source of fresh drinking water for human. However, the river pollution has become serious since untreated waste water was disposed to the river after overexploitation of nature resource. The most traditional method of river water quality assessment is collecting the water samples and performing laboratory analysis. This method is disadvantageous in that it cannot offer a synoptic view with limited sample because it is impossible to collect water sampling for all regions. Remote sensing has been widely used in meteorology, agriculture fisheries, disaster prevention, land management and environmental monitoring recently (Shi et al. 2009). With the advantages of efficiency, simplicity, synchronization, objectiveness and economy, remote sensing can effectively monitor river water quality in the respect of different space and time.
There are already some related studies applying remote sensing technology to estimate water quality. Wang et al. (2004) and Vazyulya et al. (2014) performed regression analysis for constructing statistical model between remote sensing image data and water quality variables. However, the remote sensing data that used in Wang et al. (2004) and Vazyulya et al. (2014) are calibrated from the in-situ radiometer measurements. The filed work of in-situ radiometer measurement is not only time-consuming also impossible for performing in the whole region. In this regard, this paper aimed to develop the model between reflectance value without calibration by in-situ measurement from radiometer and water quality parameters.
2. Materials and Methods
In this study, Landsat images were used to derive a proper model to estimate water quality parameters. Pre-processing of Landsat imagery includes radiometric calibration and atmospheric correction to image data. To estimate the water quality parameters from Landsat images, multiple linear regression analysis was performed by using water sampling data as ground reference data. The water sampling data were gathered and laboratory analysis was performed by Taiwan Environmental Protection Administration (EPA).
2.1 Study area and dataset
2.1.1 Study area
Tamsui River basin (Fig. 1), which is located in the northwest of Taiwan as study area, was selected as a study area. Tamsui River, the third longest river in Taiwan, is an important source of agricultural and industrial needs and drinking. Since 1970s improper waste water disposal in Tamsui River led to rapid deterioration of water quality (Wang et al. 2014). Considering the importance of Tamsui River in water supplement, it is urgent task for monitoring water quality of Tamsui River.

2.1.2 Ground reference data
Since 1976, Taiwan EPA has established a total number of 296 monitoring stations for the routine work of river water monitoring. In the region of Tamsui River basin, there are 38 water monitoring stations (Fig. 1) that collect the water samples monthly during the past two decades. The nine water quality parameters including temperature (temp), pH, electrical conductivity (EC), dissolved oxygen (DO), biochemical oxygen demand (BOD), chemical oxygen demand (COD), suspended solids (SS), ammonia (NH3-N), and coliform group are monitored monthly.
The methods of sampling and analyzing follows the standard set by Taiwan EPA for examining water and wastewater (Environmental Protection Administration, R.O.C. (Taiwan). 2010). Among those nine water quality parameters, we used four parameters, DO, BOD, SS and NH3-N for estimating river pollution index.
2.1.3 Remote sensing data
The remote sensing image dataset used contains eight Landsat-5 Thematic Mapper (TM) images and two Landsat-8 Operational Land Imager (OLI) images (WRS-2 path 117 row 43) for from northern Taiwan ranging between 2000 and 2015. From analyzing the change of the water quality of different month with considering the change of weather, Landsat images from 2000 to 2015 were used to represent each month.
The Landsat images with less than 15% percent of clouds and those acquired around the same time in-situ water qualities were measured (within +/- 10 days). There was no proper image in August and December that met the above conditions. Although there were 38 in-situ water samples for each image, some of stations’ measurements needed to be eliminated because of the unavoidable cloud cover on the Landsat scene.
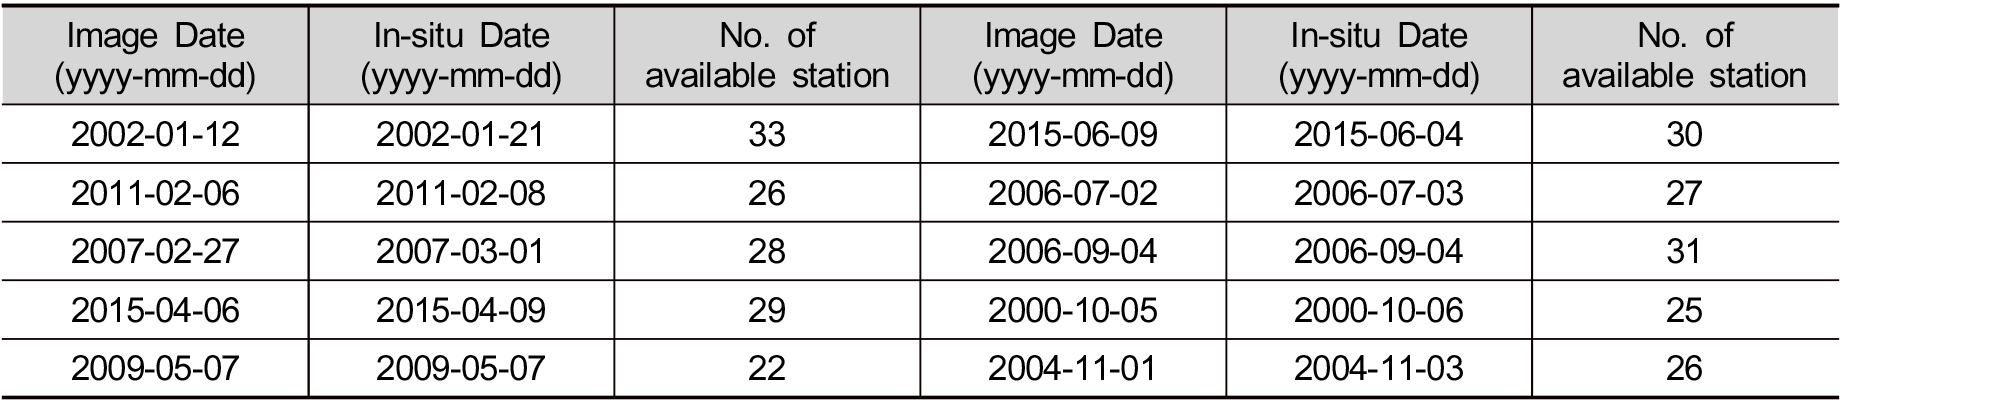
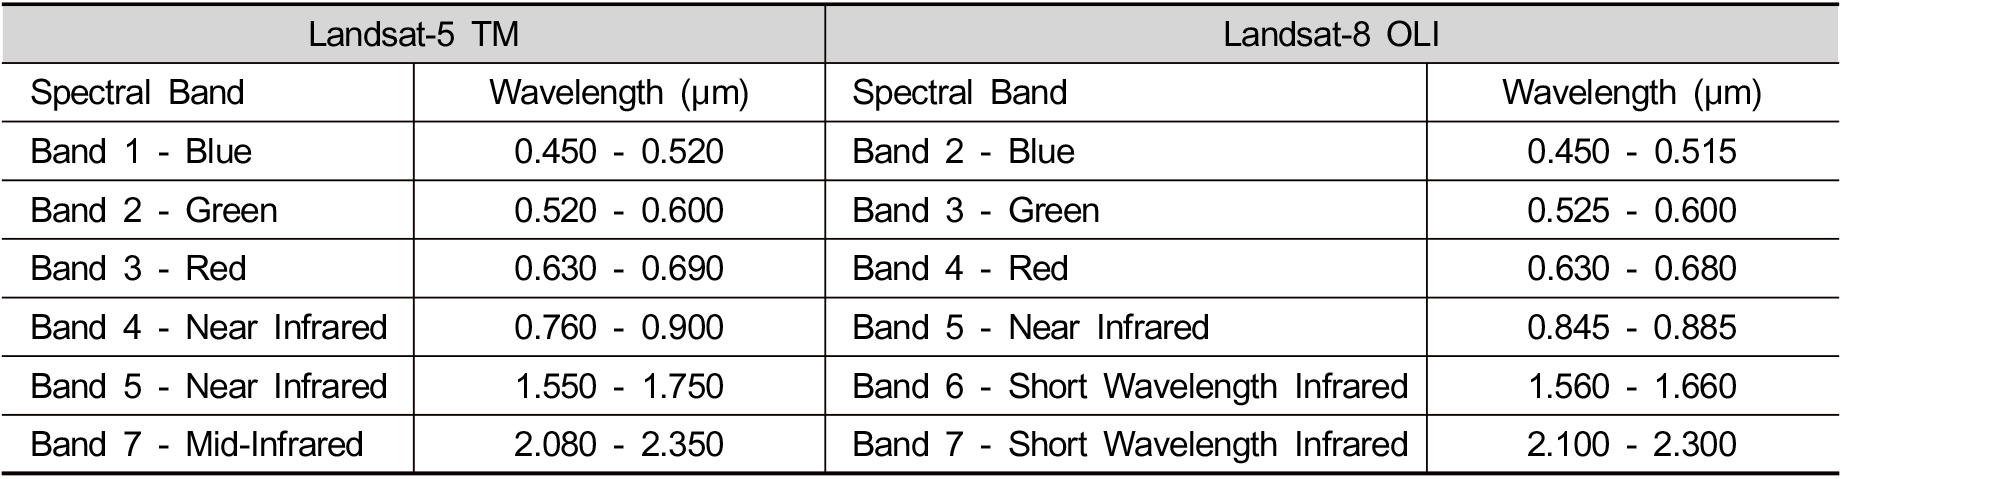
Table 1 lists the dates and the number of the available samples of each pair of the Landsat images and in-situ water sampling data. Landsat-5 TM images sensed in seven spectral bands, which band 1 to 5 and band 7 with 30 m spatial resolution and band 6 with 120 m spatial resolution, simultaneously. On the other hand, Landsat-8 OLI images sensed in nine spectral bands, which band 1 to 7 and band 9 with 30 m spatial resolution and band 8 with 15 m spatial resolution. Since both Landsat-5 and Landsat-8 images were used for construct the model for estimating water quality parameters, this study used the bands at 30 m spatial solution, available in both Landsat-5 TM and Lansat-8 OLI sensors. The bands of each sensor used for the analysis are listed in Table 2.
Table 1. The dates and the number of the available samples of each pair of the Landsat images and in situ water sampling data |
|
2.2 Method
2.2.1 Landsat image pre-processing
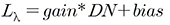
Landsat image pre-processing included radiometric calibration and atmospheric correction. The data of Landsat-5 TM sensors is in the form of 8-bit digital number between 0 to 255, the numbers need to be converted to top of atmosphere (ToA) reflectance by two-step processes. First, the digital numbers (DNs) value need to be converted into radiance by Eq. 1,
 (Eq. 1)
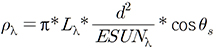
where is the radiance value of the cell (W m-2 sr-1 µm-1), DN is the digital numbers value of the cell, gain is the gain value of specific band and bias is the bias value of specific band. After conversion to radiance, the radiance needed to be converted to ToA reflectance by Eq. 2,
 (Eq. 2)
where  is the unit-less reflectance value,
  is spectral radiance of the cell from the previous step,
  is earth-sun distance in astronomical units,
  is mean solar exoatmospheric irradiance and
  is solar zenith angle.
Meanwhile, Landsat-8 OLI sensor images DNs value is 16-bit integer value (Landsat 8 Data User Handbook, year). These values can be convert to ToA reflectance by Eq. 3,
 (Eq. 3)
where  is the unit-less reflectance value,
  is reflectance multiplicative scaling factor for specific band,
  is reflectance additive scaling factor for specific band and
  is the digital value of the cell. After the DNs were converted to the reflectance values, atmospheric correction was performed for removing the effects of atmosphere from water vapor, aerosol, etc.
2.2.2 Multiple linear regression analysis
This study performed multiple linear regression analysis for relating the reflectance value of each bands in Landsat images to the actual measurement of four water quality parameters included DO, BOD, NH3-N and SS from in-situ water samples. Through the GPS location of water sampling stations, the reflectance value near the station was acquired. Then, the regression model of each water quality parameters for every month was established. The extracted reflectance values of each bands were used as independent variables and the water quality parameters were used as dependent variables to perform multiple linear regression analysis.
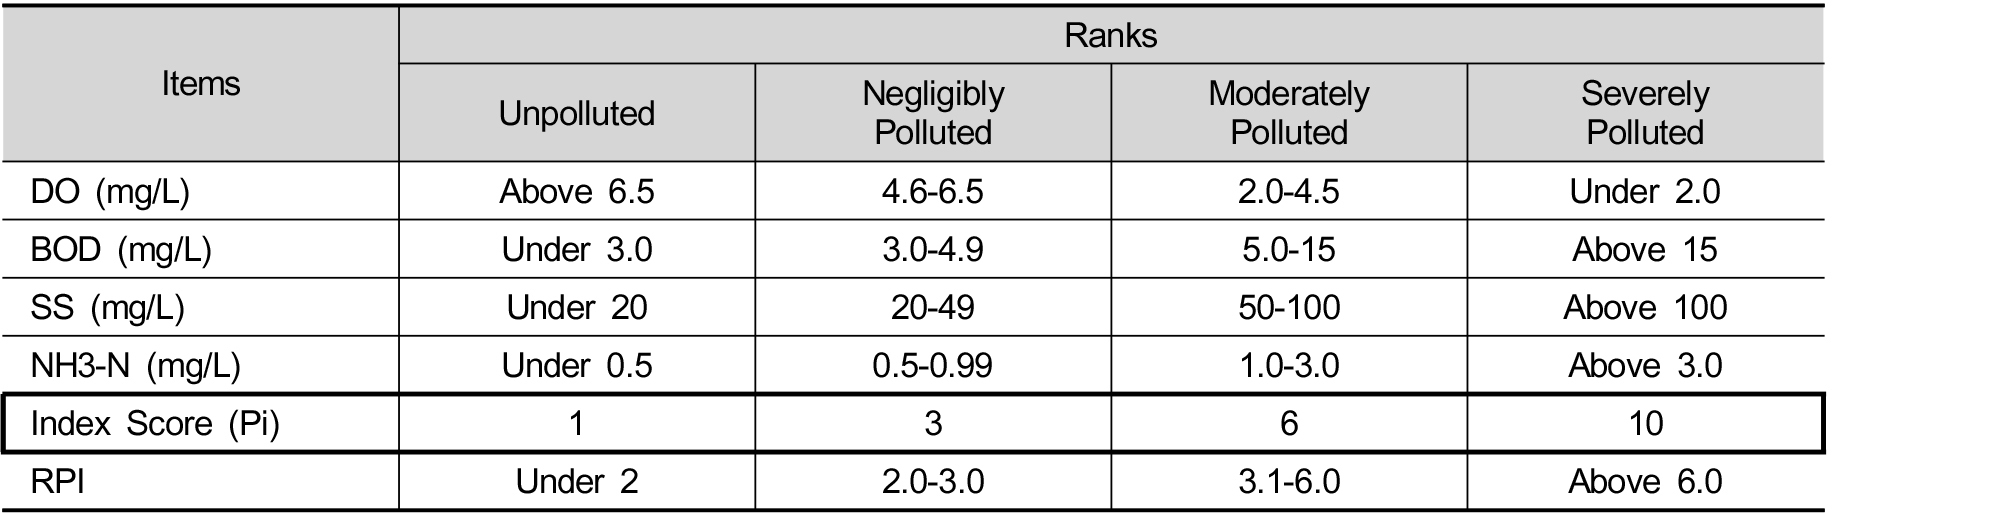
2.2.3 River pollution index conversion
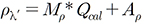
RPI has been used by the Taiwan EPA to evaluate the conditions of surfaces water pollution. RPI is a simple integrated indicator for determining the level of pollution of a river. The value of RPI is calculated by 4 parameters in water quality including DO, BOD, SS and NH3-4. Each parameter is divided into four ranks and score was assigned. The score conversion of each water parameter are shown in Table 3. The RPI is calculated by Eq. 4:
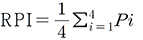 (Eq. 4)
3. Result and Discussion
3.1 Multiple linear regression model
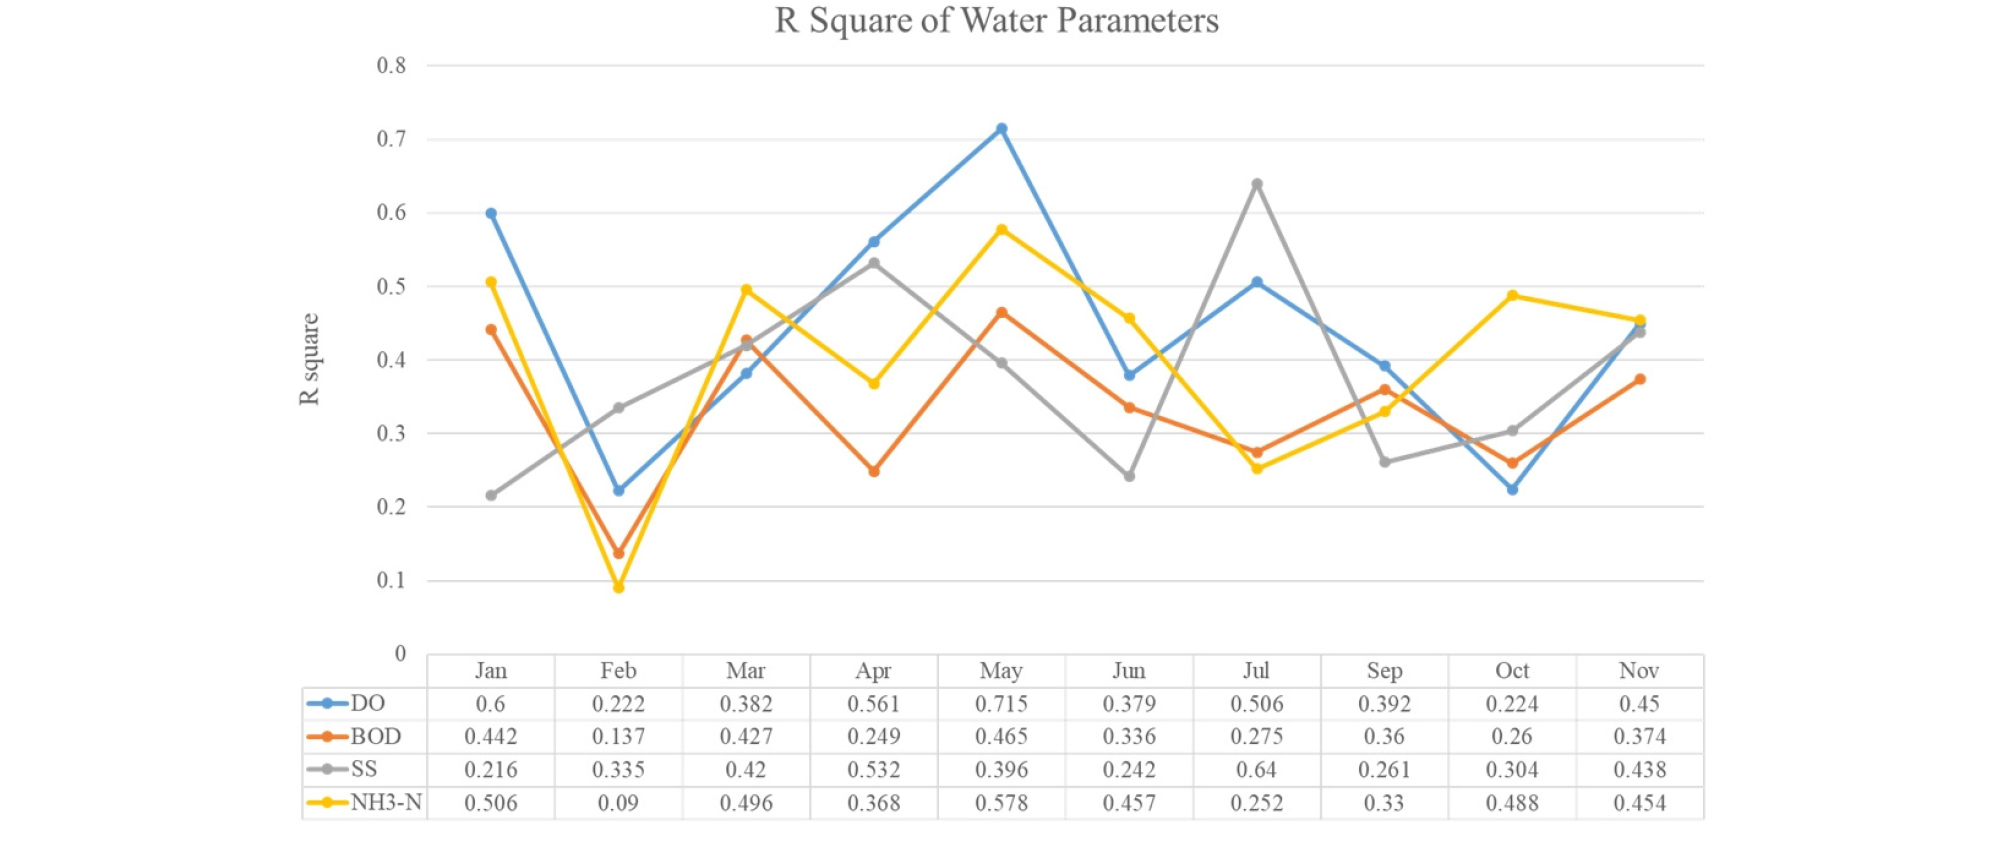
To determine the relationship between the reflectance from Landsat images and water quality parameters, multiple linear regression models were established. Water quality parameters included DO, BOD, SS and NH3-N. Regression models showed the results with R square value ranging 22.2% to 71.5% in DO, 13.7% to 46.5% in BOD, 21.6% to 64.0% in SS and 9.0% to 57.8% in NH3-N from ten Landsat images with represent of different month. The R squares of four water parameters were shown in Fig. 2. Fig. 2 shows that the model of May has the best performance and the model of February has the worst performance in four concentrated water quality parameters.
3.2 Estimation of river pollution index
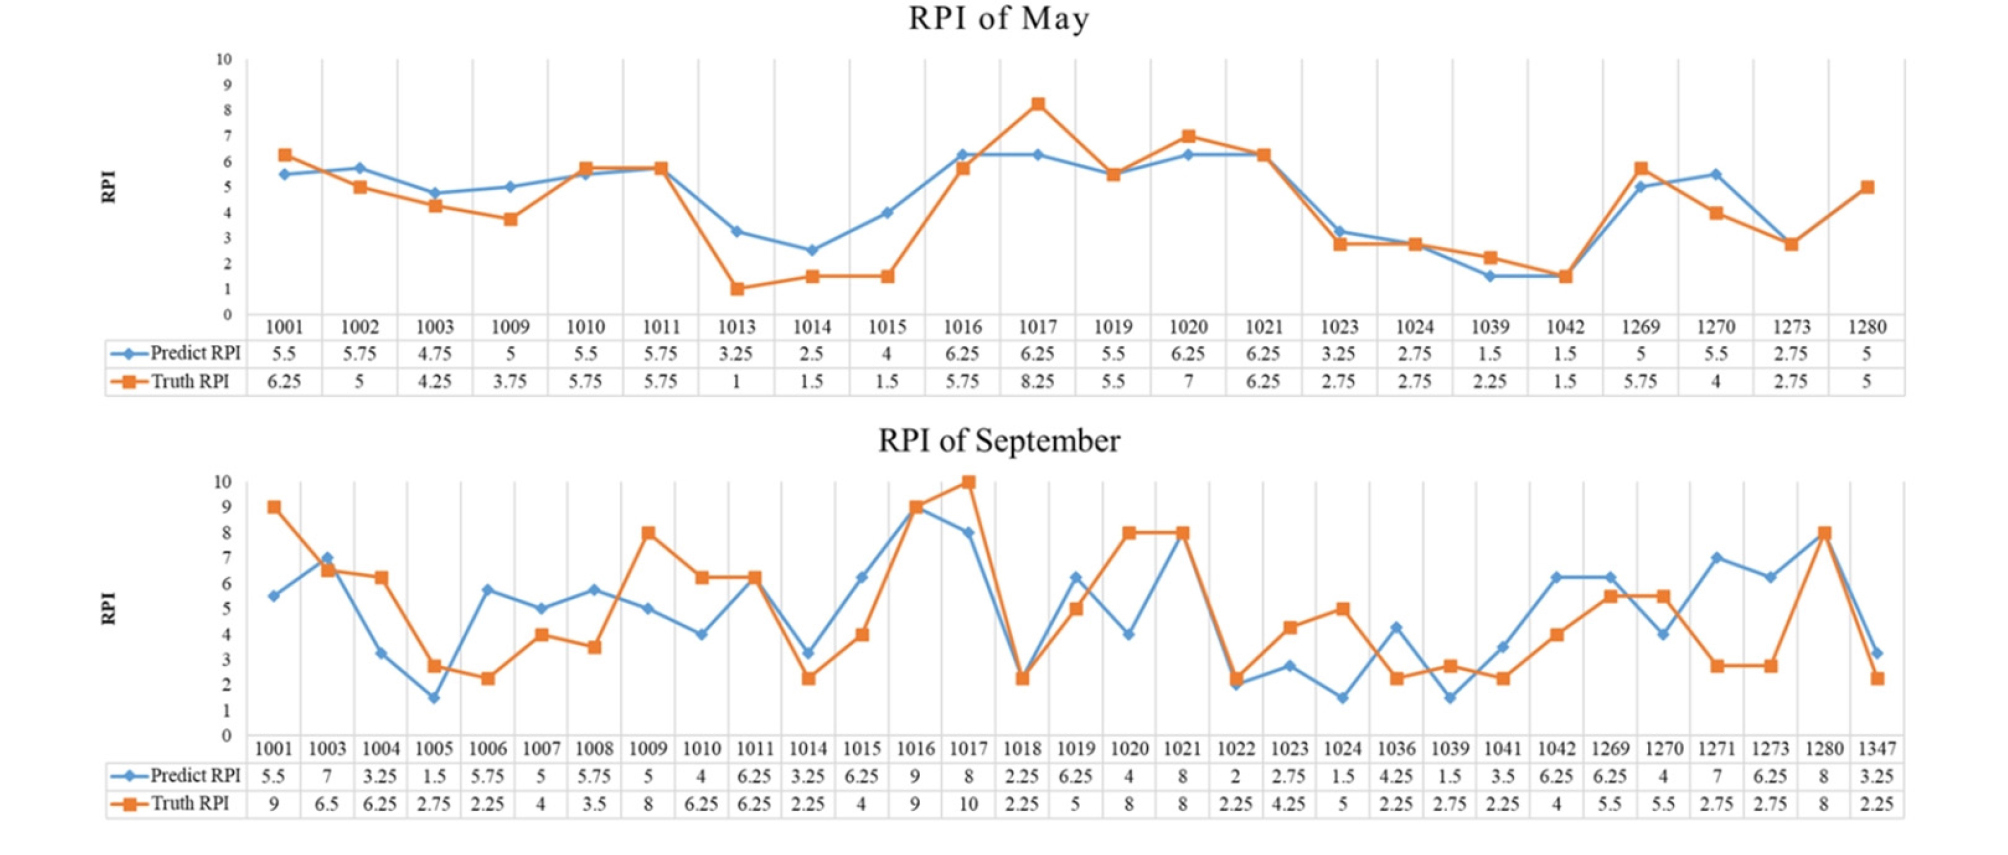
Based on the constructed models, the prediction value of four water quality parameters was determined. The predication value can be converted to RPI value and reveal the level of pollution of the location through the RPI value. After converting to the level of pollution by RPI, the percentage of predicting the level of pollution correctly ranged from 32.2% in September to 68.2% in May. The RPI conversion results from the remote sensing image of May and September are shown in Fig. 3.
4. Conclusion
The possibility of RPI estimation from remote sensing data is shown in this study. The multiple linear regression model was built with the concentrations of four water quality parameters (DO, BOD, SS and NH3-N) respectively. The R square value is ranging from 22.2% to 71.5% in DO, 13.7% to 46.5% in BOD, 21.6% to 64.0% in SS and 9.0% to 57.8% in NH3-N. Through the regression analysis, this study confirmed that the accuracy of RPI conversion which ranges from 32.2% to 68.2% is moderate. With the result from this study, the following implications could be drawn. First, the remote sensing images including Landsat 5 and Landsat 8 images needed to be done further correction since there must be some difference between two satellite. Second, although remote sensing technology can effectively monitor the river water pollution, still, more in-situ water samples are required for developing a better statistic model. Since there might be a bias when the sample size is small. If the further correction between different satellite and more samplings are available, we can look forward to retrieved a better model for water quality parameters estimation. Also, the improvement of RPI estimation can be achieved with an improved water quality parameters models.
