

1. Introduction
There are over 7,000 known amphibian species worldwide, of which many are of conservation concern (Bishop et al. 2012). The number of extinct and threatened amphibian species will continue to rise (Stuart et al. 2004). Amphibians are sensitive to various environmental changes because they use both aquatic and terrestrial habitats throughout their lives (Sewell and Griffiths 2009). Therefore, amphibians are useful as indicator organisms in monitoring ecological changes in various environments (Carignan and Villard 2002).
The Japanese tree frog (Hyla japonica) is widely distributed throughout the Korean Peninsula and is a species that lives in various environments, such as urban, rural and mountainous areas (Jang and Suh 2010). Therefore, it is considered as a suitable species for environmental monitoring across a wide range of landscapes. The Japanese tree frog uses rice paddy fields as the main breeding habitat (Park et al. 2017). Paddy fields are traditionally characterized by a rich flora and fauna, with aquatic plants and invertebrates in the surface water and terrestrial species in the vegetation (Natuhara 2013; Luo et al. 2014). Rice paddies also provide an array of ecosystem services including food security, maintaining and ensuring viability of rural communities, environmental pro-tection, and an aesthetic landscape (Natuhara 2013). Recently, some paddy-associated amphibian species may be declining in conjunction with area decline and habitat degradation (Tsuji et al. 2011). The economic value of these amphibians is emphasized in crop production because of their function as natural enemies of crop pests in paddy fields (Natuhara 2013).
It is interesting for ecologists to understand trophic relationships in amphibian communities because of the important role of amphibians in aquatic and terrestrial ecosystems (Hirai and Matsui 1999). Most amphibians occupy an intermediate position in food webs, being predators of invertebrates and prey for larger vertebrates. Previous studies of the diet of Japanese tree frog are geographically limited to Japan (Hirai and Matsui 2000; Hirai and Matsui 2002; Hirai 2007). There were no studies to compare their diet in paddy fields of rural and urban areas. In this study we determine the diet composition of Japanese tree frogs in a rice paddy in Korea for monitoring of prey quality and environmental changes in rural and urban areas.
2. Methods
We conducted this study in a rice paddy surrounded by forests in Hwayang-ri, Gangsang-myeon, Yangpyeong- gun, Gyeonggi-do, Republic of Korea (37°27'22"N, 127°29'20"E). The paddy was of traditional terraced type, with an adjacent ‘Doombeong’, a traditional small pond for irrigation. The paddy field was filled with water from April to August, during which time rice plants were cultivated. We collected Japanese tree frog (Hyla japonica) from June 18 to July 8 in 2017, just following rice transplantation into the paddy.
For the diet analysis of Japanese tree frog, we captured adults either by hand or by dip net after sunset because they are nocturnal. We measured sex, head width (HW, to the nearest 0.1 mm), snout-vent length (SVL, to the nearest 0.1 mm) and body mass (BM, to the nearest 0.1 g) of the frogs caught on site. We also used stomach flushing to collect the stomach content and identify the diet of the frogs (Solé et al. 2005). Considering the small body size of Japanese tree frog, we used 20 ml of distilled water per frog using a squeeze bottle for stomach flushing. Stomach contents were stored in 70% ethanol for subsequent laboratory analysis. The frogs were released back immediately after their activity returned to normal.
In the laboratory, natural objects such as twigs, leaves and stones were excluded from the stomach contents as they might have been accidentally swal-lowed during feeding. Diet items were identified to the highest taxonomic resolution possible. For all species identification, we consulted the illustrated guidebooks of Kim (2002; 2012), An (2010), Paek et al. (2010), Heo (2012; 2016), Jung (2012) and Jang et al. (2015). We measured number, length (L) and width (W) (both, to the nearest 0.1 mm) of all items within diet samples. The volume (V) of each prey item was calculated using the formula for an ellipsoid (Dunham 1983).
V = 4/3 π (L/2) (W/2)2(Eq. 1)
In order to elucidate the relationship between the body weight of Japanese tree frog, and the volume of diet materials, the regression analysis was used from packages ‘vegan’ (Oksanen et al. 2016) and ‘ggplot2’ (Wickham 2009) in the R Statistical Environment (R version 3.4.0, R Core Team 2017).
3. Results and Discussion
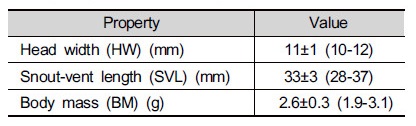
The average values of morphological characteristics of Japanese tree frog (Hyla japonica) studied here were 11 mm in head width, 33 mm in snout-vent length, and 2.6 g in body weight (Table 1). All frogs caught for the study were male because we could catch male frogs making advertisement calls at night. Com-pared to previous studies of Japanese tree frog in rural paddies (Park and Cho 2017), the head width and snout-vent lengths that we recorded were greater, and body weight measurements were smaller. Further studies are necessary to clarify the cause of the low ratio of body weight to body size of the frogs in this area.
Table 1. Morphological properties of Hyla japonica (all males) captured for study of diet composition (Mean±SD, range in parenthesis, n=12)
 |
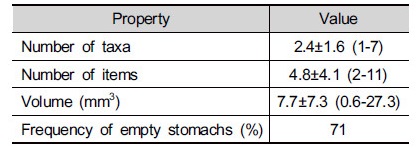
From the analyses of diet items by stomach flushing, the frequency of empty stomachs was very high in this study (Table 2). This could be linked to previous findings that frogs stop eating, or reduce prey intake during the breeding season (Hirai and Matsui 2000; Tiberti et al. 2016). The average numbers of taxa and items per stomach were 2.4 and 4.8, respectively (Table 2). The average volume of stomach contents was estimated to 7.7 mm3. The number of prey items per stomach was similar to previous reports from Japan (Hirai and Matsui 2000), however the volume of prey was smaller.
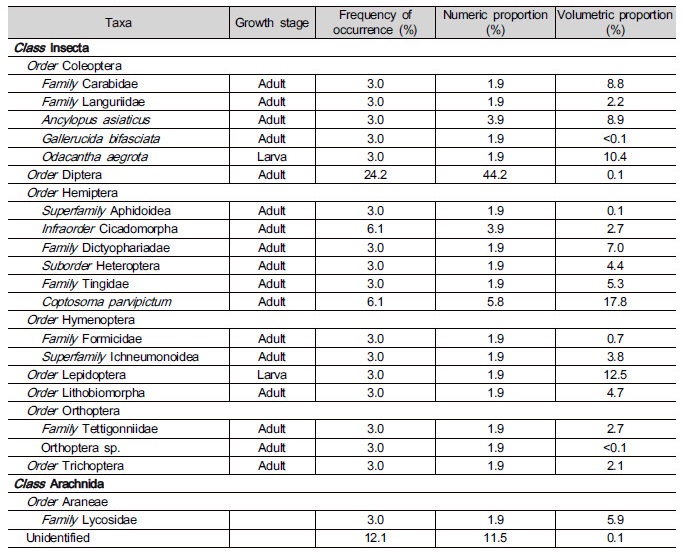
There were limitations in identifying the prey items because some samples were damaged, presumably during the digestive process. From twelve stomachs of Japanese tree frog, we extracted 52 individual prey items. All prey items from the stomachs belonged to Arthropoda, and included two classes, Insecta and Arachnida (Table 3). Only one order, Araneae, was found in Arachnida (Table 3). Most prey items were adults in the life cycle except larvae of Odacantha aegrota (Coleoptera) and Lepidoptera species (Table 3). Prey items from the class Insecta consisted of eight orders, and comprised 98% in number and 94% in volume of the total identified items. Among Insecta, beetles (Coleoptera), flies (Diptera), and bugs (Hemiptera) occurred most frequently in stomachs (Table 3). Flies occupied very low proportion of total volume of prey although their frequency of occurrence was high (Table 3). On the other hand, butterflies and moths (Lepidoptera) occupied a large volumetric proportion despite their low frequency (Table 3). The diet com-position results from this study were very similar to previous results from the same frog species in a Japanese paddy (Hirai and Matsui 2000), however abundance of ants (Formicidae) was much lower in our paddy (Table 3). Most prey items of Japanese tree frog were terrestrial insects, except Lycosidae (Arach-nida, often found floating on the water surface) and caddisflies (Trichoptera, habitat changes from aquatic larvae to terrestrial adults). There was a positive correlation between the body weight of Japanese tree frog and the volume of the diet (p=0.042) (Fig. 1).

In conclusion, calling males of Japanese tree frog frequently had empty stomachs and their diet com-position was composed of mainly terrestrial insects belonging to beetles (Coleoptera), flies (Diptera), bugs (Hemiptera) and butterflies and moths (Lepidoptera) in a rice paddy in South Korea. Japanese tree frog occurs in wide ranges of habitats from urban areas to highly conserved mountain area (Park and Cho 2017; Park et al. 2017). Growth status and diet composition of Japanese tree frogs can be used as a bio-indicator of environmental change. Our results therefore provide a basic framework to guide the monitoring project to conserve various landscapes.
