

1. Introduction
There are various stress factors that affect fish while they grow. Fish productions tend to vary depending on the level of stress inflicted on them. These stress factors can be categorized into two: natural stress and artificial stress (Donaldson 1981). The former includes red tide, cold water mass, rainy spell in the summer, flood, heavy snow, etc., which fishers could take measures to deal with in some way or another. With regard to the latter, they’re also very aware of how it may arise and they can handle its effects on culturing fish (Hur 2002).
Noise and vibration affecting fish are propagated in water longer than in air, and at 4 times the speed. This is because water absorbs noise (Lee and Hur 2004). Fish in water can sense not only mechanical vibration but also vibration below audible oscillatory and supersonic waves. In water, their sensitivity changes according to the velocity, movement and pressure of water particles, and so on. When sonic vibration delivered to fish penetrate into water, they can sense this vibration transferred to their inner ears through auditory ossicles in the head. And some fish sense vibration using their bladders (Park et al. 1995).
Generally, fish sense low–frequency (5 to 25 Hz) vibrations. Vibrations at 16 to 13,000 Hz can be captured through their sacculus and lagena in the lower part of inner ears, while vibrations at 18 to 30 Hz (including audible vibration, low-frequency vibration and vibration around the boundary) are captured through either a sidetrack or also the inner ears. But there are some fish that can also sense vibration through their bladders (Evans 1993).
Catfish, Silurus asotus, are widely distributed, mainly in the freshwater systems of Korea, China and Japan in East Asia. Generally, catfish farms are located in quiet places with favorable water con-ditions; soft-shelled turtles (i.e. Pelodiscus sinensis), eels (i.e. Anguilla japonica) and catfish are very sensitive to noise and vibration (Lee and Hur 2004). A recent significant decrease in freshwater fish productions has resulted in their substantial imports from China. In addition to this, a gradual increase in anthropogenic activities (e.g. urbanization and industrialization) has adversely impacted catfish cultures (MMAF 2014).
But there have been few domestic and overseas studies on metabolic and physiological responses to vibration stress in a culture environment, which is why there is a need to research these kinds of subjects. Accordingly, this study investigates short- period indexes for stress responses, including primary (e.g. plasma cortisol), secondary (e.g. plasma glucose, AST, ALT, Na+, K+ and Cl–), and tertiary (e.g. mortality) stress responses.
2. Materials and Methods
In this study, 450 catfish samples that were captured at a station point in the Kunsan National University, Korea, were used. To estimate their mean length and weight, 30 catfish were sampled; they showed 22.9±0.9 cm in mean±SD length and 100.7±11.7 g in mean±SD weight (n=30). 450 catfish as mentioned above had been cultured in a lab aquarium tank for 2 weeks before they were used in this study. They were subdivided into nine groups, each of which contained 50 catfish, and then released into nine 2,000 L circular FRP (Fiberglass Reinforced Plastic) tanks (with 290 cm × 80 cm in diameter and 50 cm in depth). Three electric vibrators (MX-3500, Macstar Co., Korea) were attached to the end side of each tank outer shell.
Those nine groups were re-grouped into three (including one control group and two stress groups). The control group (catfish farms typical noise) was exposed to vibration corresponding to 48 dB (V) (produced using the electric vibrators) for 15 minutes per hour every day, and the two stress groups were exposed to vibration corresponding to 58 and 68 dB (V) (produced using the same electric vibrators), equally, for 15 minutes per hour every day. To exclude other possible stress factors that might affect fish, the lab was darkened and water temperature was automatically set at 24.5 to 25.5°C (using a temperature control system) while the tests were undertaken. Catfish in the non-stress group (n (no. of catfish per tank) = 50) were maintained for 11 days under the same environmental conditions as in the stress groups, except for vibration factor.
The blood of each fish sample was sampled from a caudal blood vessel complex within one minute using heparinized syringes at day 0 (before starting vibration stress tests (“BE”)), and at days 1, 3, 5, 7, 9 and 11 (after starting vibration stress tests). For this blood sampling, however, no anesthetic was used. Catfish whose blood was sampled were excluded (i.e. removed from each tank).
The HCT (hematocrit), RBC (red blood cells) and Hb (hemoglobin) of catfish whose blood was sampled were analyzed using an automatic blood analyzer (Excell 500, Danam Electronics, Dallas, TX, USA). Blood samples were kept for less than 5 minutes in 2-mL vacuum containers (treated with sodium fluoride or potassium oxalate) (Vacutainer, UK) and 1.5 mL polypropylene microcentrifuge tubes that contain pieces of ice, and then centrifuged at 5,600 g for 5 minutes. Their plasma was collected and stored in a deep freeze (CLN-500 UW Nihon Freezer; Nihon Co., Japan) at -70°C before they were analyzed.
The level (or concentration) of plasma cortisol in 50 mL of blood samples was measured and determined using RIA (radioimmunoassay) (Donaldson 1981) and RIA kits (Coat-A-Count TKCO Cortisol RIA Kit; DPC, USA). Mixtures of blood samples in 100 mL of antiserum were incubated at 37°C for 45 minutes, and then 1,000 mL of separation reagent was added to. These mixtures were placed in a refrigerator (set at 4°C) for 15 minutes, and then centrifuged at 1,200 g for 15 minutes. Supernatants were assayed for gamma radiation using an automatic gamma counter (Cobra Ⅱ, Packard Co., USA). The levels of plasma glucose, AST (aspartate amino-transferase) and ALT (alanine aminotransferase), Na+, K+ and Cl– were measured using an automatic chemistry analyzer (Hitachi 7180, Hitachi, Japan).
Tests were carried out three times, and their results were reported in the form of Mean±SD (n=5) (unless stated otherwise). Data was analyzed by a one-way ANOVA using SPSS 9.0, a statistical package (Norusis 1995). Means were separated using Duncan's multiple range tests, and considered “significantly different” if P<0.05.
3. Results
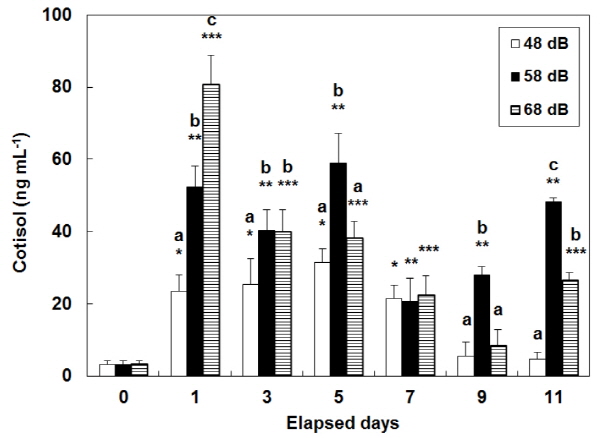
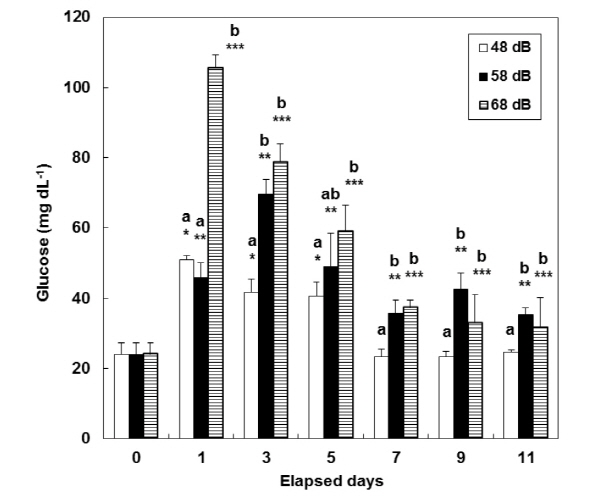
Consecutive stress caused a continuous increase in plasma cortisol whose level amounted to 3.1±1.2 ng mL-1 at day 0 (i.e. BE) (Fig. 1). In the control group (exposed to vibration at 48 dB), cortisol level was at its maximum (31.5±3.9 ng mL-1) after day 5, and then decreased at days 9 and 11. In the 58 dB group, cortisol level significantly increased during the test period (20.7±6.4 - 58.9±8.3 ng mL-1) (P<0.05). In the 68 dB group, the cortisol level was the highest at 80.5±8.3 ng mL-1 after day 1, when there were significant differences among the three groups (P<0.05). In the 48 dB group, the level of plasma glucose increased from 24.0±3.3 at day 0 to: 51.0±1.0 at day 1; 41.7±3.8 at day 3; and 40.7± 3.8 ng mL-1 at day 5. Since then, it decreased for days 7 to 11 (Fig. 2). In the other two stress groups (58 dB and 68 dB), the level of plasma glucose significantly increased from day 0 during the test period (P<0.05).
In the stress groups (58 dB and 68 dB), consecutive stress caused a continuous increase in the level of plasma AST and ALT (Fig. 3, 4). At days 7 and 9, there were significant differences in the level of plasma AST among the three groups (P<0.05). In the 58 dB group, the level of plasma Na+ signifi-cantly increased (P<0.05) from 132.7±7.1 at day 0 to: 146.0±2.2 mE qL-1 at day 7; and 143.3±2.3 mE qL-1 at day 11 (Table 1). In the 68 dB group, consecutive stress caused a continuous increase at days 1, 7, 9 and 11. The two groups showed a similar tendency in the level of plasma K+ and Cl- at the same days.
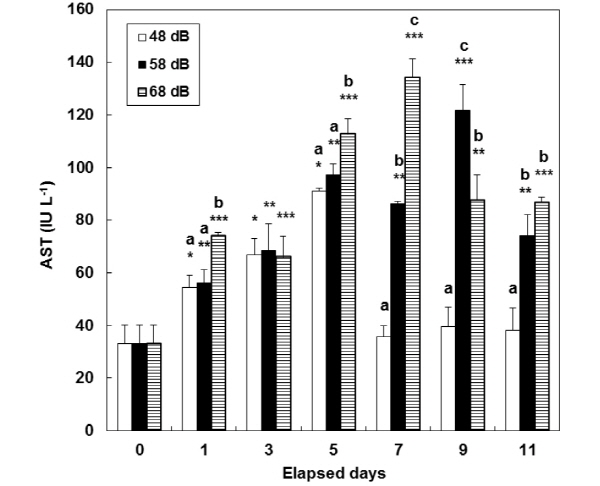
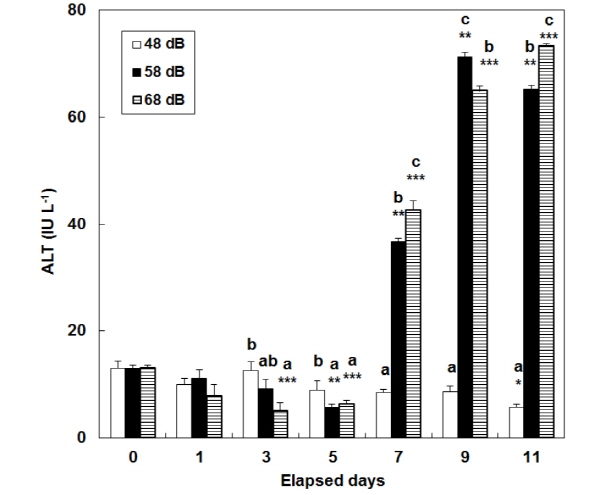
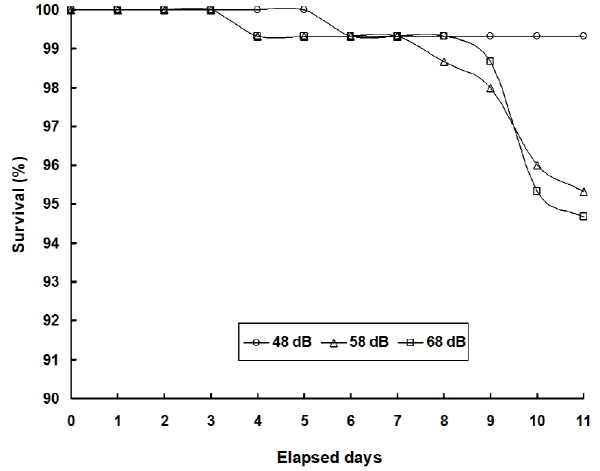
Table 2 shows variations in the level of RBC, hematocrit and hemoglobin in plasma exposed to vibration stress at day 11. In the stress groups (58 dB and 68 dB) at day 1, the level of RBC, hematocrit and hemoglobin significantly increased from day 0. At day 11 after vibration stress, mortality rate in the three groups (48 dB, 58 dB and 68 dB) was 0.7, 4.7 and 5.3%, respectively (Fig. 5).
4. Discussion
Cultured freshwater fish productions in 2014 totaled up to 20,761 M/T (metric ton), of which cultured catfish occupied 16.0% (corresponding to about 4,607 M/T) in Korea (MMAF 2014). Compared with other freshwater fish, cultured catfish have significantly increased with an increase in catfish consumptions. Generally, catfish reach a marketable size within one year. This is why they are competitive in terms of marketability, compared with other cultured fish. They tend to start spawning in April and grow to marketable-sized catfish in September. They grow fast, especially in summer when water conditions are favorable for their growth.
But recently-increasing anthropogenic activities (e.g. industrialization, urbanization, roadwork, etc.) have caused lots of vibration stress, which, in turn, have adversely affected the surrounding aquaculture farms (Lee and Hur 2004, Lee et al. 2007, Hur et al. 2009). For example, construction works mainly started in spring to end in autumn, which is signifi-cantly correlated with their adverse effects on the surrounding catfish farms. But there have been few studies on catfish, although the adverse effects of such vibration on Pelodiscus sinensis and Anguilla japonica were addressed in some studies (Lee and Hur 2004, Lee et al. 2007).
It was reported that the increasing level of plasma glucose in blood samples with an increase in the level of plasma cortisol resulted from a general reaction to stress inflicted on fish (Barton and Iwama 1991). In this study, glucose level was found to increase with an increase in cortisol level that resulted from stress inflicted on fish. This led to a demand for much energy. Hur (2002) reported that in olive flounder, Paralichthys olivaceus, the cortisol level would get back to a normal status, i.e. at the levels they were at originally, 24 hours after acute stress had been inflicted on them. In this study, however, vibration stress was repeated every day to identify its possible effects on a continuous basis. Variations in the level of plasma cortisol and glucose at day 1 were, on the whole, similar to reactions to stress, although this level of plasma cortisol and glucose increased with an increase in stress. The 48 dB group was exposed to vibration similar to the corresponding one that tended to happen in aquaculture farms. But the same reactions didn’t appear since different conditions, other than vibration, were different in aquaculture farms; in this study, reactions to stress continued until day 7. Some metabolic levels were recovered within 24 hours, but others required a longer time to return to their normal status after the fish had experienced stress. Pickering (1993) reported that a physiologi-cally complete recovery from stress would take as long as 2 weeks.
Hur (2002) held that stress-related disturbances caused primary, secondary and tertiary stress responses. Primary stress responses activate brain centers. This, in turn, leads to the release of such hormones as cortisol and catecholamine from steroid- producing cells and chromaffin cells in head kidney, respectively. Secondary stress responses can be defined as the subsequent actions and effects of the foregoing hormones (i.e. cortisol and catecholamine) at a blood and tissue level. These kinds of responses may include the disturbances of hydromineral and metabolic balances. Tertiary stress responses are correlated with the performance of organisms (e.g. inhibited growth). These kinds of responses hamper reproductions and immune suppressions in them.
In this study, the level of plasma AST and ALT increased while tests continued, so that it could be known whether there were any effects on internal organs. Plasma AST and ALT are aminotransferases distributed in a liver and spleen. Their level decreases when animals are in a healthy status, while it increases when they get sick or there necroses occurs in their tissues (Almeida et al. 2002). Davis and Parker (1990) reported that hemodynamic indices for oxygen carrying ability increased with an increase in stress. In this study, the level of plasma AST and ALT at day 0 was significantly different from the corresponding one at the end of tests. This indicates that it could be known how different vibration inflicts physiological burdens on a liver or spleen and any other tissues. The level of plasma AST and ALT in this study were similar to the corresponding one as shown in the previous study on P. sinensis (Lee et al. 2007). They (i.e. Lee et al. 2007) found that stress factors injured P. sinensis in the liver and spleen. This indicates that vibration inflicted on catfish (this study was involved with) might have given significant physiological loads to their liver and other tissues.
Davis and Parker (1990) reported that hematological indices for oxygen transmission ability increased when stress was present. The level of hematocrit, RBC and hemoglobin in blood samples is among basic blood factors through which oxygen transfor-mation ability can be estimated. In this study, their level showed such reactions to stress as other blood items accompanied with exposure to vibration.
A decrease in the level of hemoglobin and RBC indicates that there are some troubles with oxygen supply and demand; actually, a decrease in the level of hemoglobin causes a decrease in respiration quotient (Rodriguez et al. 1989), and a decrease in the level of blood hemoglobin and RBC (in charge of receiving and transforming oxygen) may disrupt the supply and demand of oxygen (Perry and Reid 1993), and also cause problems with energy mobili-zation. If stress gets weakened, catfish will increase their hemoglobin and RBC level, and reinforce oxygen supply and energy mobilization to handle such stress. But catfish exposed to continuous stress will be significantly affected, and consequently, their hemoglobin and RBC level will decrease. This, in turn, leads to a decrease in oxygen con-sumptions. The previous studies on P. olivaceus reported that, if they were exposed to temperature and transportation stress, their hemoglobin and RBC level increased abruptly, and then return to their original status quickly (Chang et al. 2001, Hur et al. 2007, Hur et al. 2008). This indicates that such small-scale stress as related to temperature and transportation may cause any blood-specific disorders that would not last so long. In this study, catfish couldn’t adapt themselves to continuous stress. And further, they couldn’t return to their original status when this kind of stress acted on them.
In this study, the analysis of blood indices for cortisol, glucose, AST, ALT, RBC and hemoglobin in catfish showed that they were significantly affected by vibration. Catfish are among teleostei that inhabit river bed. This is why they were more sensitive to vibration and other stress factors. Physiological activities and several other kinds of variation were measured in the study; still, there is a need to measure more items, including histological variations, in internal organs, and investigate different phy-siological activities in terms of a mechanism for determining how different stresses cause physiological exhaustions.
 -arenergic signal transduction in fish: interactive effects of cate-cholamines and cortisol. Fish Physiology and Biochemistry 11(1-6): 195-203.