1. Introduction
2. Materials and methods
2.1 Study site and sampling
2.2 Physicochemical analysis
2.3 Microbiological analysis
2.4 Geostatistical analysis
3. Results and Discussion
4. Conclusions
1. 서 론
1. Introduction
Understanding spatial distribution of microorganisms is important in studying of ecosystem functions because they play important roll to control ecosystem function but are not always homogeneous. The spatial distribution of microorganisms in many different environments and at various spatial scales has been studied (Berardesco et al., 1998; Danovaro et al., 2001; Franklin et al., 2002; Franklin and Mills, 2003; Moran et al., 1987; Scala and Kerkhof, 2000). Berardesco et al., (1998) investigated the community of bacteria that has same function and reported the community in sediment is diverse and changes by time but does not change spatially in a small scale. According to Franklin et al. (2002), community properties changes along the elevation rather than horizontal position. On the other hand, denitrifying bacteria composition was found to vary horizontally and along seasons, as well (Scala and Kerkhof, 2000). Not only the bacterial community but the distribution of enzyme activities and organic matter were also studied (Danovaro et al., 2001). Physical and chemical properties of the environment interact with microbial properties, and this interaction affects the spatial heterogeneity of those variables (Franklin and Mills, 2007). Microorganisms in intertidal flat sediment mediate an important ecosystem function of intertidal flat, which regulates the material flux between terrestrial and marine ecosystem. In this study, spatial variations of physicochemical and microbiological variables were examined to understand spatial heter-ogeneity of those variables in an intertidal flat.
2. Materials and methods
2.1 Study site and sampling
This study was conducted in a intertidal flat de-veloped on the shore at Yoecha-Ri in Ganghwa Island, western part of South Korea (37°34′~37°38′N, 126°20′~126°30′E). The site is a part of intertidal flat of Kyounggi-bay that is one of the well preserved intertidal flats in Korea. Soil texture was sandy loamy. Samplings were conducted at a low tide within 3 hours from a spring tide. Samples were collected in July 2007. Three quadrates (1m x 1m) were established with intervals of 160 cm on intertidal flat along a transect (ca. 8 m) perpendicular to shore line. Sediment samples were collected at the interval of 10 cm by 50 ml portable syringe with sharpened edge.
2.2 Physicochemical analysis
Soil pH was determined in 1:5 soil slurry by a pH meter (Thermo orion 420A). Water content was de-termined by an oven-drying method (at 103°C for 24 hours) and organic matter content was measured by loss-on-ignition (at 600°C for 24hours). The DOC content was determined by extracting sediment with distilled water. Sediment and distilled water were well mixed and centrifuged at 5500 ×g for 15 minutes, followed by filtration by a 0.45 µm GF/C filter. Then it was analyzed by a TOC analyzer (Shimadzu TOC- 5000A). Anions (NO3-, SO42-, Cl-) were analyzed by ion chromatography (DIONEX, AS14 column).
2.3 Microbiological analysis
A methyllumbelliferyl (MUF)-substrate analogue method was used to analyze extracellular enzyme activities. β-glucosidase, N-acetyl-β-D-glucosaminidase, phosphatase and arylsulfatase activities were measured with 400μM (4-methylumbelliferyl β-D-glucoside, 4-methylumbelliferyl N-acetyl-β-D-glucosaminide, and 4-methylumbelliferyl sulfate, Sigma) or 800 µM (4-methylumbelliferyl phosphate, Sigma) substrate solu-tions, respectively, which ensured substrate saturation.
One and half gram of sediment was placed in a test tube with 5ml substrate solution. Then the samples were incubated for an hour, with mixing at every 20 minutes. Supernatant was centrifuged at 7711 ×g for 5 minutes to stop the reaction. Fluorescence in supernatant was measured by fluorometer (TD-700, emission 450 nm/ excitation 330nm). Quenching effects and product absorption were corrected by adding 10 µM mety-lumbelliferone solution to a separate soil samples. The activities are expressed as nmol MUF released g-1dry soil min-1.
Bacterial diversity was also analyzed by 16S rRNA T-RFLP (terminal restriction fragment length poly-morphism) analysis.
2.4 Geostatistical analysis
Autocorrelation of each variable were studied by a geostatistical analysis, during this process experimental variograms were constructed with a continuous function to estimate model parameters (e.g., the spatial de-pendence and range (the correlation length scale). Spatial correlations between two variables were evaluated by applications of a Cross-Mantel test with a Monte Carlo procedure (with 999 permutations).
3. Results and Discussion
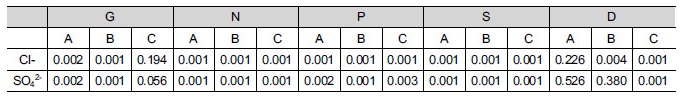
Most variables showed strong spatial autocorrelation or no spatial structure except for DOC (Fig. 1), which exhibited a spatial dependence with ‘ranges’ between 38 and 97 cm within sampling limits (Table 1). This suggests that controlling factors for the distribution of DOC might be resulted from complex interactions between physicochemical and microbiological properties in sediment. In addition, intertidal flat sediment ap-peared to be spatially heterogeneous even within small area (< ca. 8 m2) inferred from different patterns of spatial autocorrelation for most variables from each quadrates (Fig. 2). Bacterial diversity was found to be spatially correlated with four extracellular enzyme activities (p < 0.003), and chloride and sulfate were spatially correlated with microbial properties (p < 0.002) (Table 2). This probably indicates that salinity in coastal environment would be one of the major environmental factors to influence spatial distributions of decomposition capacities mediated by micro-organisms.

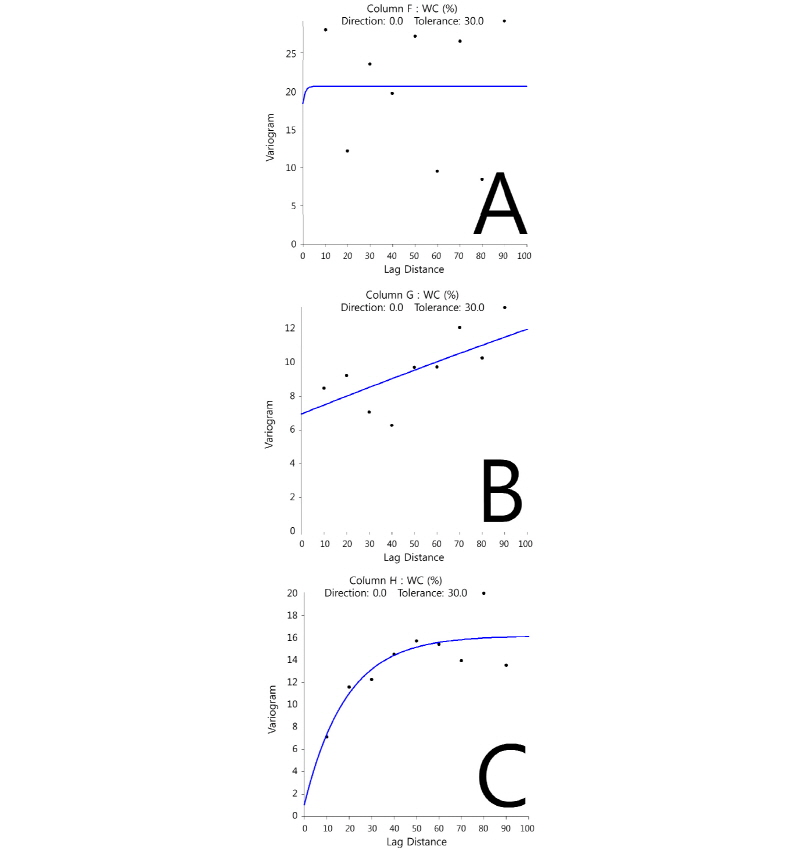
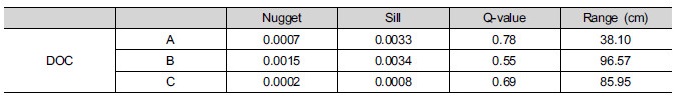
Table 1. Summary of model parameters obtained by fitting an exponential equation to the experimental variograms
for DOC. A,B and C are corresponding to those of figure 1.
 |
These variables were fitted with linear variograms rather than exponential variograms, indicating that these properties of samples were spatially autocorrelated within sampling limits or the sampling limits were not enough to analyze the spatial variability at this sampling scale.