

1. Introduction
2. Methods
2.1 Study site
2.2 Vegetation mapping
2.3 Field survey
2.4 Data analysis
3. Results
3.1 Floristic characteristics
3.2 Vegetation distribution
3.3 Phytomass
4. Discussion
4.1 Floristic characteristics of the reservoir drawdown zone
4.2 Biomass of the drawdown zone vegetation
1. Introduction
A reservoir is the water body formed, or modified, by human activity to provide a reliable and controllable water resource (Thornton et al. 1996). The water body is contained by embankments or a dam and then subsequently managed in response to specific needs, for example water supply, power generation, agricultural irrigation, river regulation and flood control, fisheries, aesthetic recreation, and navigation (Thornton et al. 1996). Worldwide, there are more than 58,000 large dam reservoirs (with a height >15 m or between 5 m and 15 m from the lowest foundation to the crest, impounding more than 3,000,000 m3; International Commission on Large Dams 2018), and more than 800,000 smaller ones (Nilsson and Berggren 2000). Reservoirs, therefore, store about 10,000 km3 of water, which amounts to ca. five times the water volume of all rivers present in the world (Chao 1995). In spite of this, the hydrological and ecological importance of reservoirs are frequently underestimated compared to natural lakes (Thornton et al. 1996).
In both lakes and reservoirs, the dominant forces controlling the structure and function of these ecosystems and aquatic–terrestrial interface processes are the extent, frequency and duration of water level fluctuations (Leira and Cantonati 2008, Cho and Cho 2013). In reservoirs especially, the water level of the reservoir can vary considerably as it because it is manipulated by management to suit operational objectives as well as responding to natural hydrological process. Where there is a small fluctuation in water level, a littoral zone of aquatic macrophytes can develop in a similar way to a natural lake (Hill et al. 1998). However, in a reservoir there the fluctuations are large, areas that have been flooded areas are exposed to the air as the water level drops followed by re-submergence again as the water level rises again. During this cycle, the environment changes suddenly and repeatedly between aquatic and terrestrial conditions. The water level fluctuation area is usually defined as the drawdown zone, the area of land at the edge of a water body where there this frequently exposure-submergence cycle occurs through changing water levels (Abrahams 2005).
Within this drawdown zone a distinctive biota is found that is adapted to these rapidly changing environments (Hill et al. 1998, Abrahams 2005). Plant species, in particular, are affected, either through direct wave action (e.g., physical disturbance) or indirectly by the reworking of substrates (e.g., the wetting and drying of soils) (Wilcox and Meeker 1992, Cho and Cho 2015a, b). Both plant species and their community show characteristic properties in response to water level fluctuation (Keddy and Frazer 2000). For example, in reservoirs with a large water level fluctuation, perennials and aquatic macrophytes cannot survive usually, but short-lived and annual plants, that are adapted to settling on the temporarily-exposed ground colonize when the water level drops (Keddy and Reznicek 1986, Lu et al. 2010). Therefore, it is to be expected that the floristic composition within the drawdown zone of reservoirs will be different from aquatic or upland terrestrial ecosystems. Floristic characteristics can also be expected to be influenced by many other interacting environmental factors in the drawdown zone, e.g., hydrology, geomorphology, soil and water, and human disturbance (Cho and Cho 2015b).
The vegetation in the drawdown zone also plays an important role in the provision of ecosystem services (Millennium Ecosystem Assessment 2005, Jones et al. 2010, Yuan et al. 2013), for example by stabilizing the shoreline by preventing erosion, improving water quality by trapping sediment and pollutants, mitigating climate change by increasing the carbon sink, conserving biodiversity by providing food, cover, nesting, and sanctuary for animals, and providing natural beauty maintenance to improve cultural values and heritage. The biomass of vegetation is considered as a major driver of these functions (Lohbeck et al. 2015) but can also be a good indicator of ecosystem stress and environmental change in the drawdown zone (Lopez and Siobhan Fennessy 2002).
In Korea, water inflow into reservoirs is concentrated in the summer period because of the monsoonal climate. During this period, the inflow can be very large, especially in those mountainous areas where the reservoirs serve very large catchments. These reservoirs have been constructed to both prevent summer floods but also to secure a year-round, stable water supply. The Soyangho Reservoir is one such reservoir; it is the largest in South Korea with a water surface area of 70 km2 (Kim et al. 2000). The water level of this reservoir is managed for flood control and water supply and produces a very wide annual range of water level fluctuation. Between 1974 and 2017, the mean range was 23 m with a range of 13 to 37 m (Korea Water Resources Corporation 2018), producing a large drawdown zone along the reservoir shoreline. Because of the topographical features of the reservoir within a natural river valley the slope of the drawdown zone is very steep near the dam but is gentler in the upstream areas distant far from the dam. We would expect, therefore, that the flora, the plant communities and the vegetation biomass would vary considerable within the drawdown zone of this reservoir.
The specific objectives of the study were to measure: (1) the floristic composition within the drawdown zone with respect to distance from the dam and slope angle; (2) the distribution and areas of the major plant communities, and (3) the biomass of the major plant communities, and then estimate total biomass in the drawdown zone of the Soyangho Reservoir, Korea, of wide water level fluctuation due to monsoonal precipitation and water resource management.
2. Methods
2.1 Study site
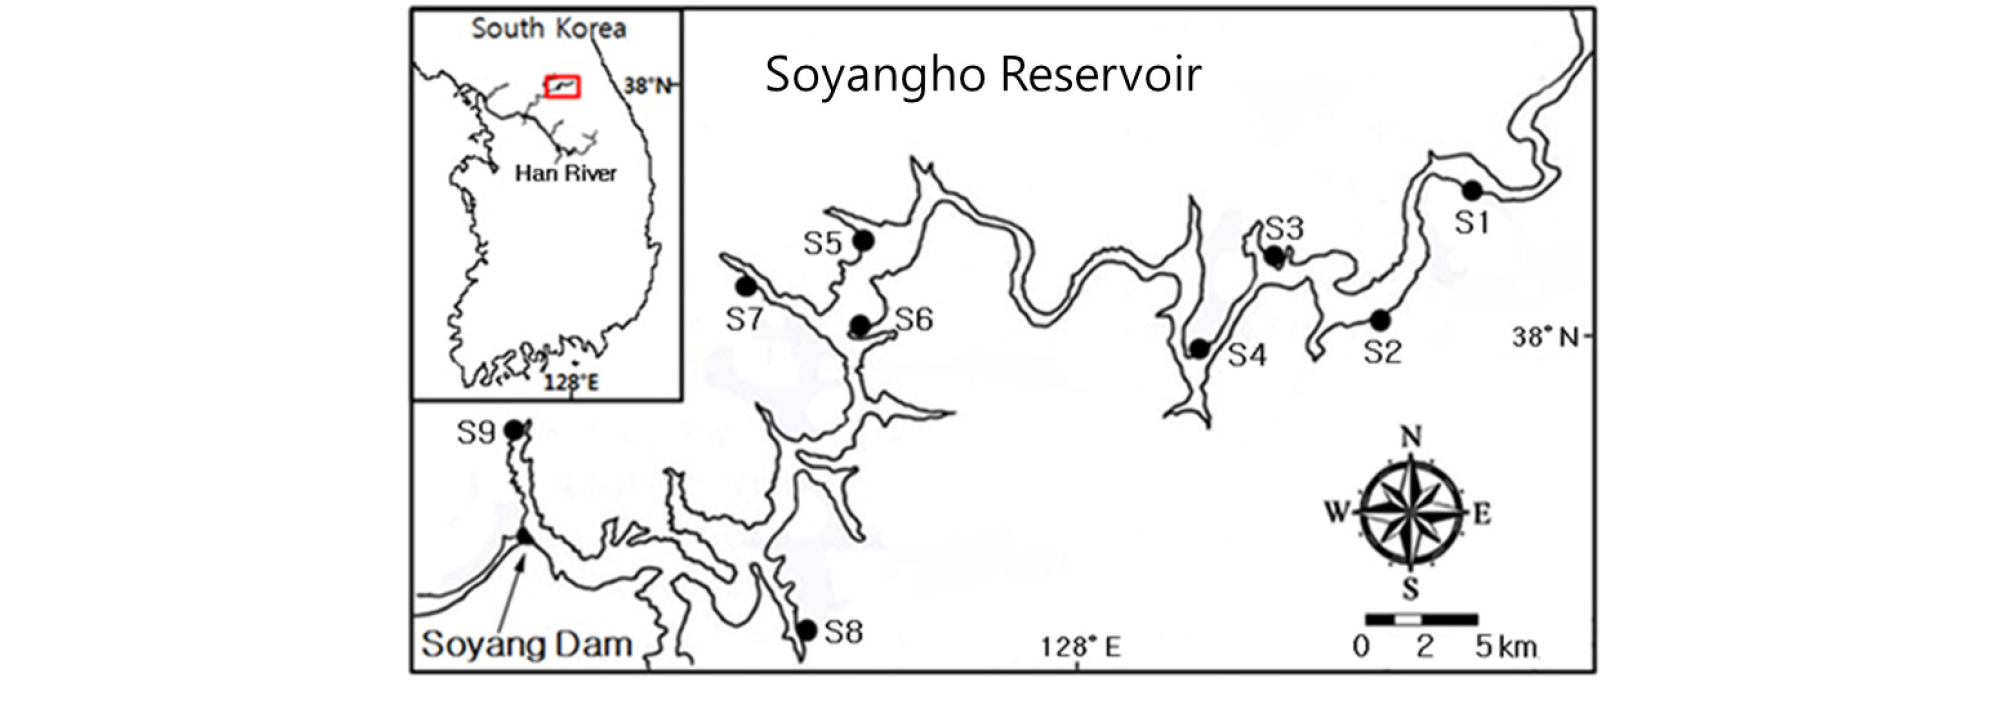
This study was conducted in the drawdown zone of the Soyangho Reservoir, South Korea, which was constructed in 1973 on the Bukhangang River for flood prevention, water supply, hydro-electric power generation and recreation (Fig. 1). The Reservoir is the largest in South Korea with a water surface area of 70 km2, a mean depth of 42 m (max=118 m) and water storage capacity of 2.9 × 10⁹ m3 (Kim et al. 2000). It is located in a mountainous area and has a dendritic shape; its main channel is 60 km in length and a mean width of 0.5 km, but it has many lateral branches extending up submerged valleys stretching up to 5 km from the main axis (Kim et al. 2000).
The climate is temperate, with an annual mean temperature of 11.1°C and an average annual precipitation of 1,347 mm (Weather Station Chuncheon; Korea Meteorological Administration 2018). More than half of the annual precipitation falls during the summer, rainy-period of the East-Asian Monsoon. For water resource and flood control management, the water maximum levels have been designated as 198 m for flood control and a minimum level of 150 m (all based on sea level; Korea Water Resources Corporation 2018). The maximum potential range of water level fluctuation is, therefore 48 m (198-150 m). The annual cycle of the water level in the flood-control dam shows a maximum level after the September flood decreasing gradually to a minimum before the summer rains start (Fig. 2). In 2010, the measured water level reached a maximum of 189.4 m on 26 September and the minimum of 159.5 m on 15 July, i.e. a range of 29.9 m (Korea Water Resources Corporation 2018), thus producing a large draw-down zone.

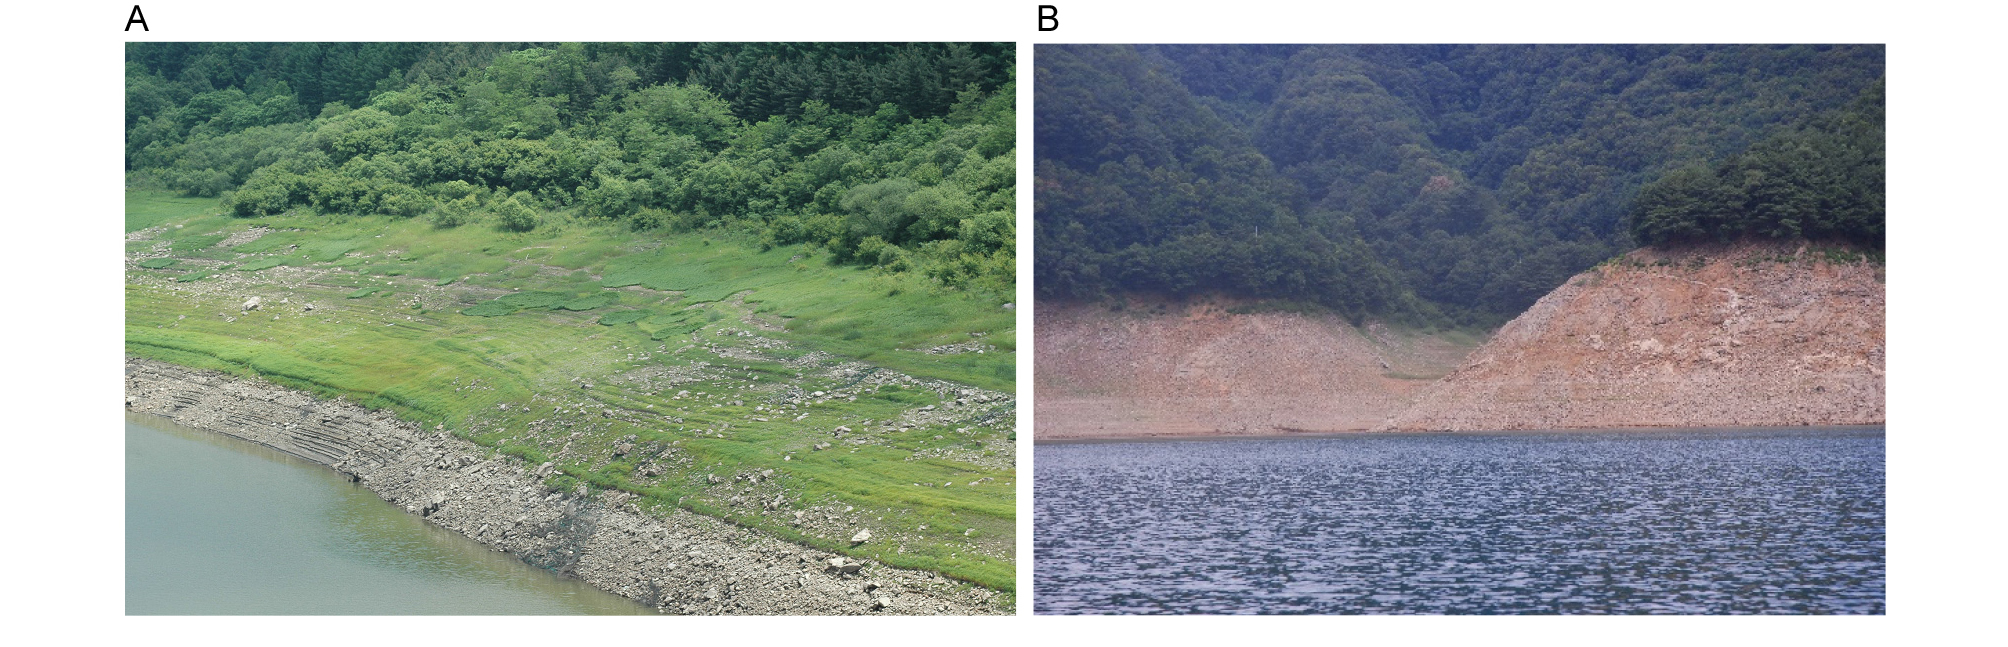
Within the drawdown the shorelines slopes in the main reservoir were very steep (>20°), often with exposed bare rock without vegetation. However, in the upstream areas of the lateral branches and especially near stream inflows, the slopes are gentler (<20°) and shoreline vegetation becomes established. Forage crops such as oat and rye can be cultivated in this part of the drawdown zone in the spring and early summer before the water level rises.
To assess the flora within these drawdown zones nine sites were selected for survey (Fig. 1 and Table 1). In general, the slope decreased with increasing distance from the dam.
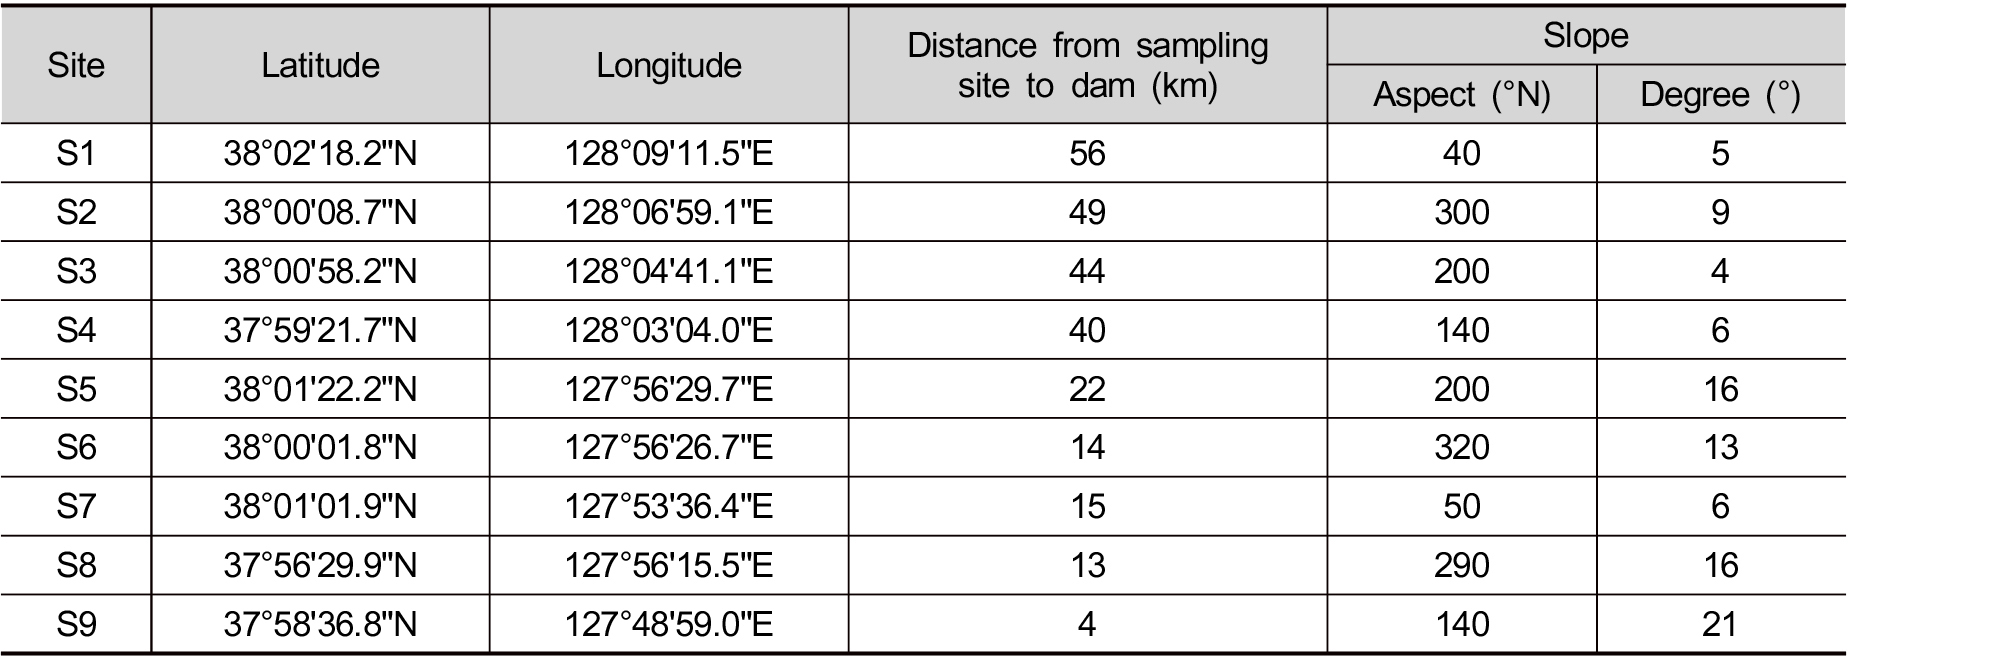
Table 1. Location of the sampling sites within the drawdown zone of the Soyangho Reservoir, South Korea, along with their distances from the dam and aspect and degree of slope |
|
2.2 Vegetation mapping
Initial vegetation maps (1:10,000; Korea Geographic Information Institute 2010) reflecting the cover of the dominant species within the drawdown zone were made for each site through interpretation of aerial photographs taken in 2008 (resolution=50 cm; Daum, 2010) using ArcGIS 9.3. These were ground-truthed and improved by field survey in 2010. The area of each of the vegetation types was calculated for the entire reservoir drawdown zone.
2.3 Field survey
Between May and July 2010, a transect was sampled through the drawdown zone at each site; the transect started from just below the terrestrial vegetation down to the water’s edge and all vascular plants were counted. Botanical nomenclature followed the Korean Plant Names Index (Korea Forest Service 2017). Thereafter, in July 2010, immediately before submergence, above-ground biomass was determined for the dominant plant communities. Ten quadrats (50 cm × 50 cm) were placed at random in each community and all vegetation harvested with secateurs, transported to the laboratory and oven-dried at 80°C to constant weight. The predominant aspect and slope of each transect were also recorded with a compass and clinometer. The distance from the dam to the site was measured along the water channel on the map of the scale of 1:25,000.
2.4 Data analysis
Multivariate analysis was performed using the ‘vegan’ package (Oksanen et al. 2016), within the R statistical environment (R version 3.4.0; R Core Team 2017). The relationship between the flora data and the environmental factors was explored using principal coordinates analysis (PCoA; function ‘cmdscale’) based on a dissimilarity matrix derived fro0000m the presence/ absence data of the flora (Bray-Curtis index; function ‘vegdist’). The environmental variables were fitted passively to this ordination using the ‘envfit’ function and 1,000 permutations. On the other hand, the multiple stepwise regression was applied using the ‘step’ function of the R (R Core Team 2017) to find the major environmental factors affecting the number of species in the drawdown zone.
3. Results
3.1 Floristic characteristics
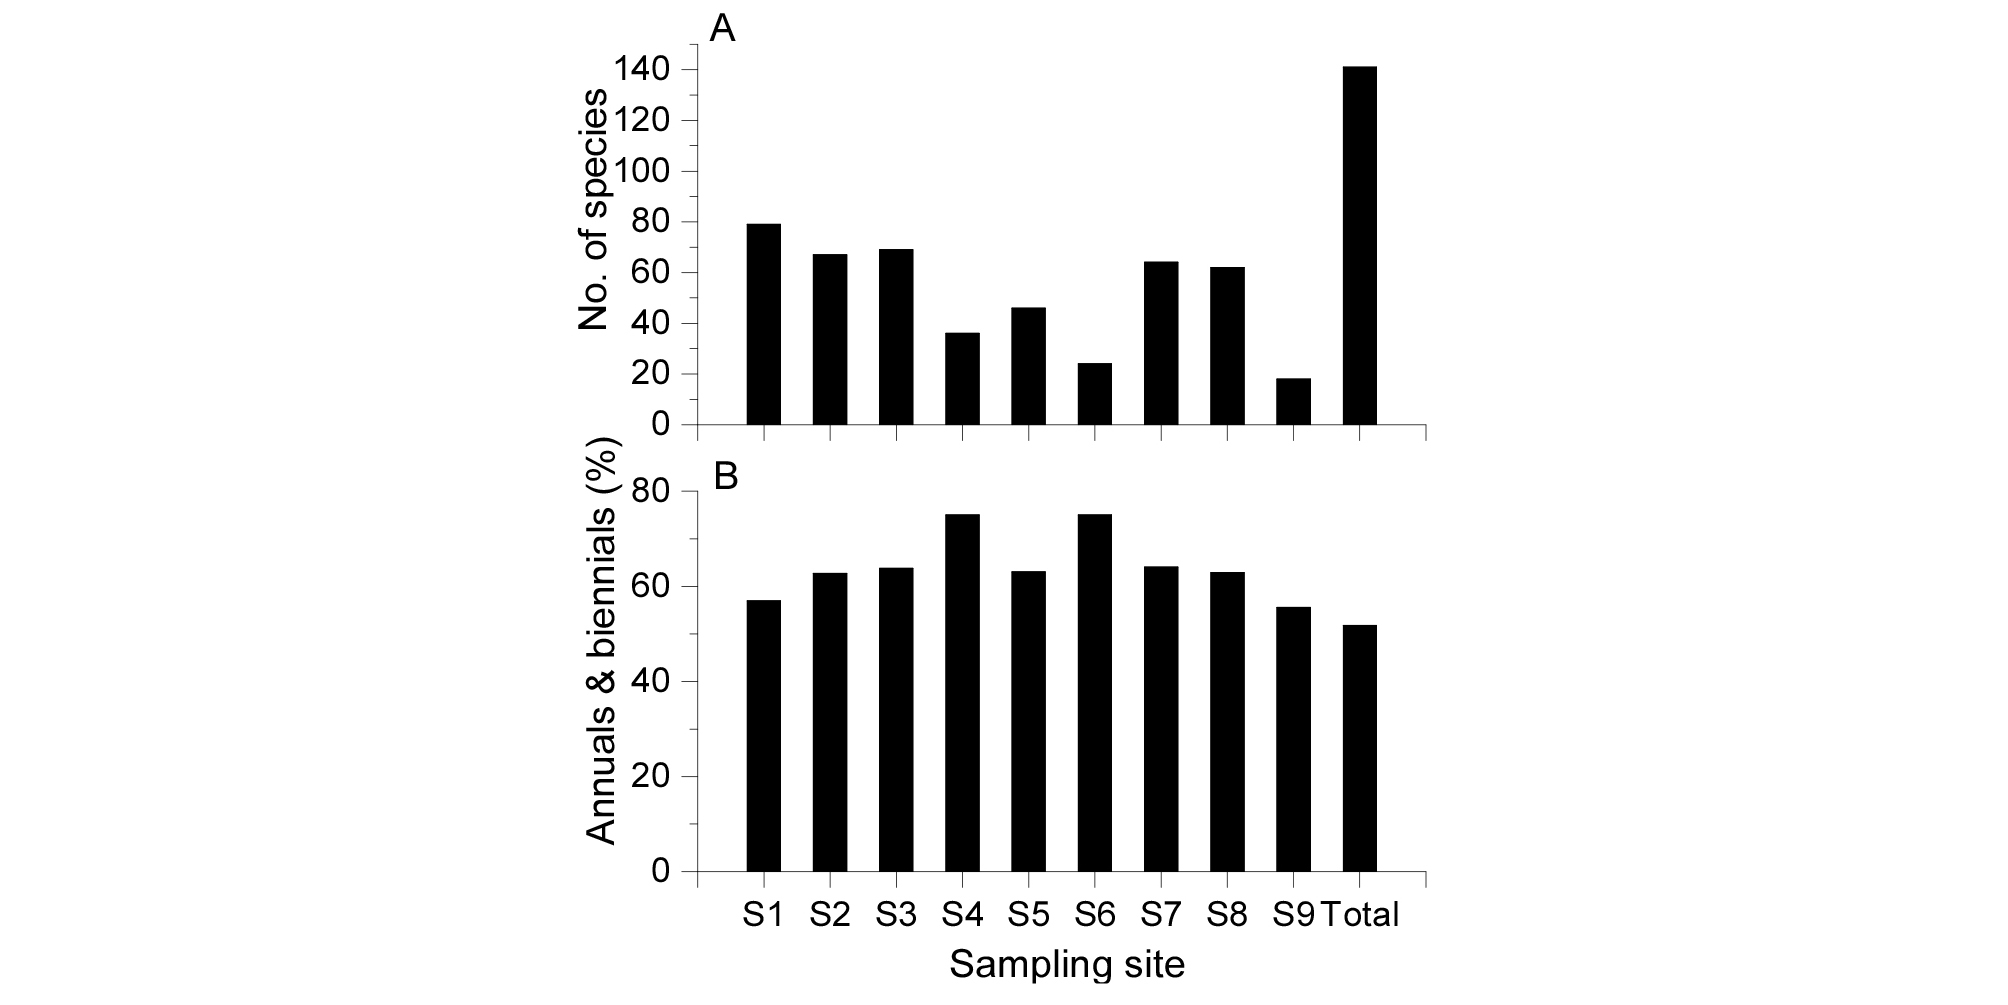
A total 141 species of vascular plants were found in the drawdown zone in the Soyangho Reservoir (Fig. 3 (a)). The commonest species, i.e., detected in at least 8 sites, were all annual or biennial herbs, i.e., Ambrosia artemisiifolia, Bidens frondosa, Bidens radiata var. pinnatifida, Calystegia hederacea (originally perennial, but in this reservoir it regenerates from seeds every year), Cnidium monnieri, Commelina communis, Conyza canadensis, Gnaphalium affine, Matricaria chamomilla, Oenothera biennis, Persicaria nodosa, Persicaria trigonocarpa. Indeed, more than 90% of all species were herbaceous species. Only 11 tree species were detected, and the majority can be described as hygrophytes (i.e., Acer tataricum subsp. ginnala, Salix gracilistyla and Salix koreensis), lianas (i.e., Parthenocissus tricuspidata, Rubus parvifolius and Smilax china) or shade-intolerant shrubs (i.e., Lespedeza bicolor, Rubus crataegifolius and Stephanandra incisa). Species richness was very variable, with between 18 and 79 species per site. Species richness was correlated with distance from the dam; greatest at the most distant site (site 9) and lowest at the closest one (site 1) (Fig. 3 (a)). More than half the species were annuals or biennials (52%, 73 species; Fig. 3 (b)); they were especially abundant at sites 4 and 6, where they represented >70% of the species present.
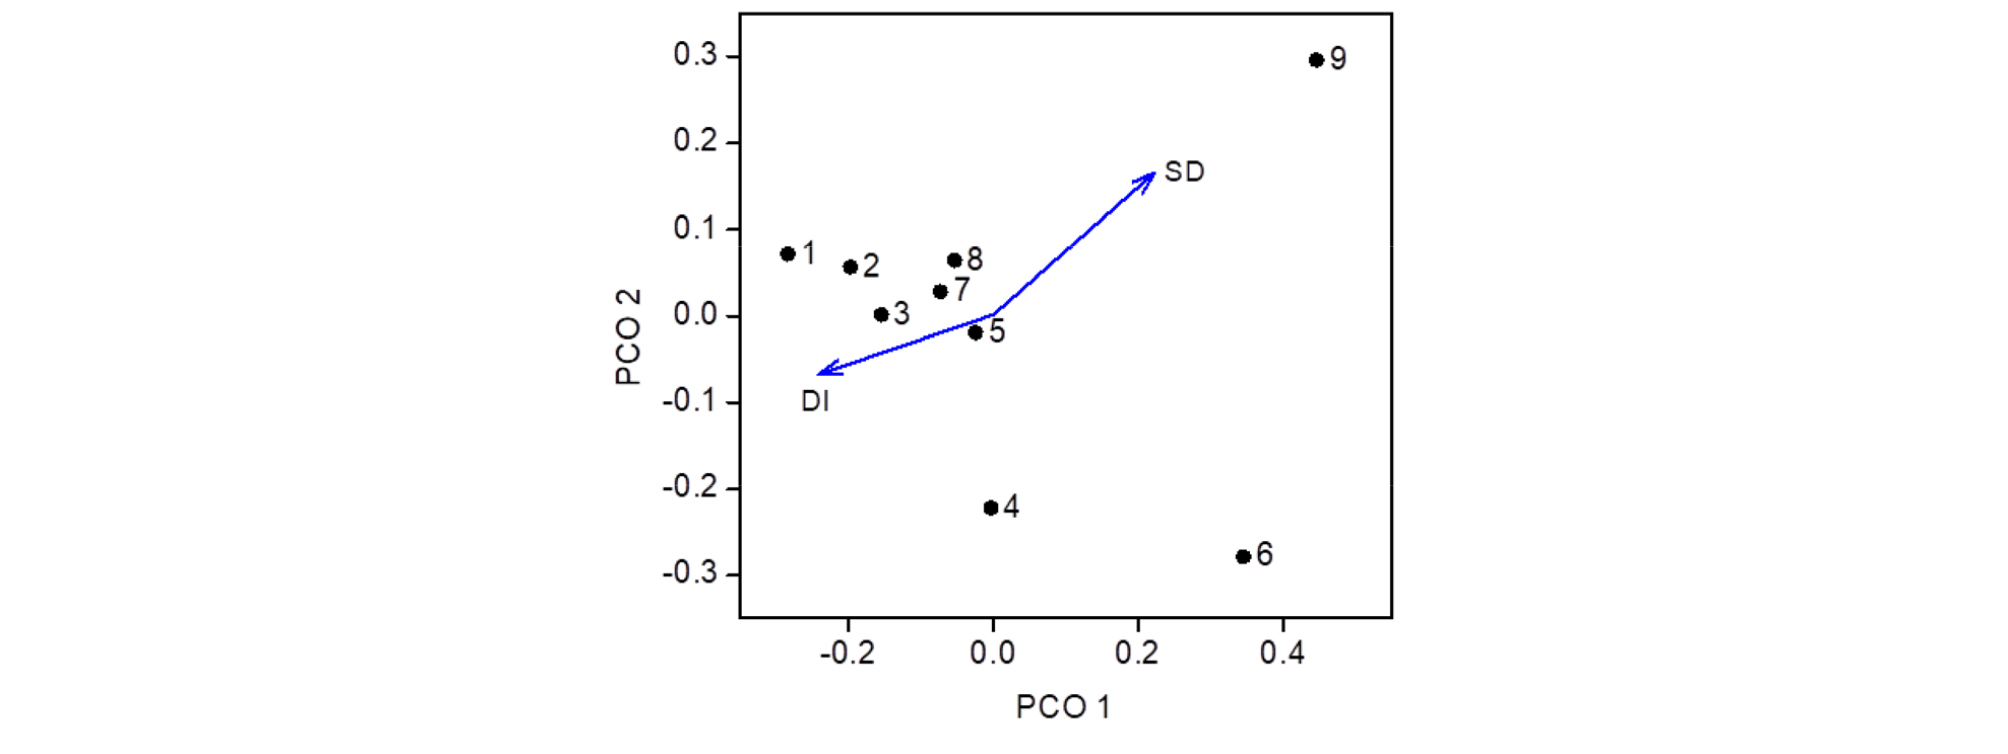
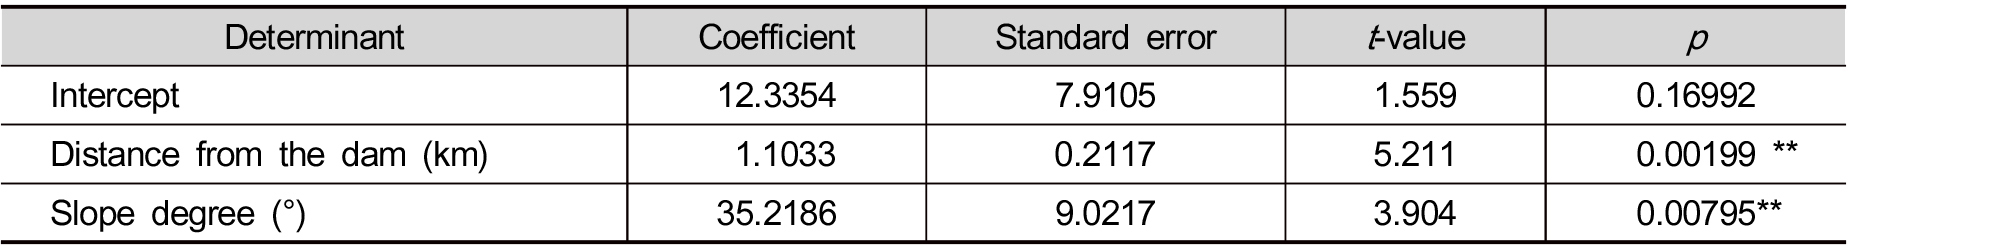
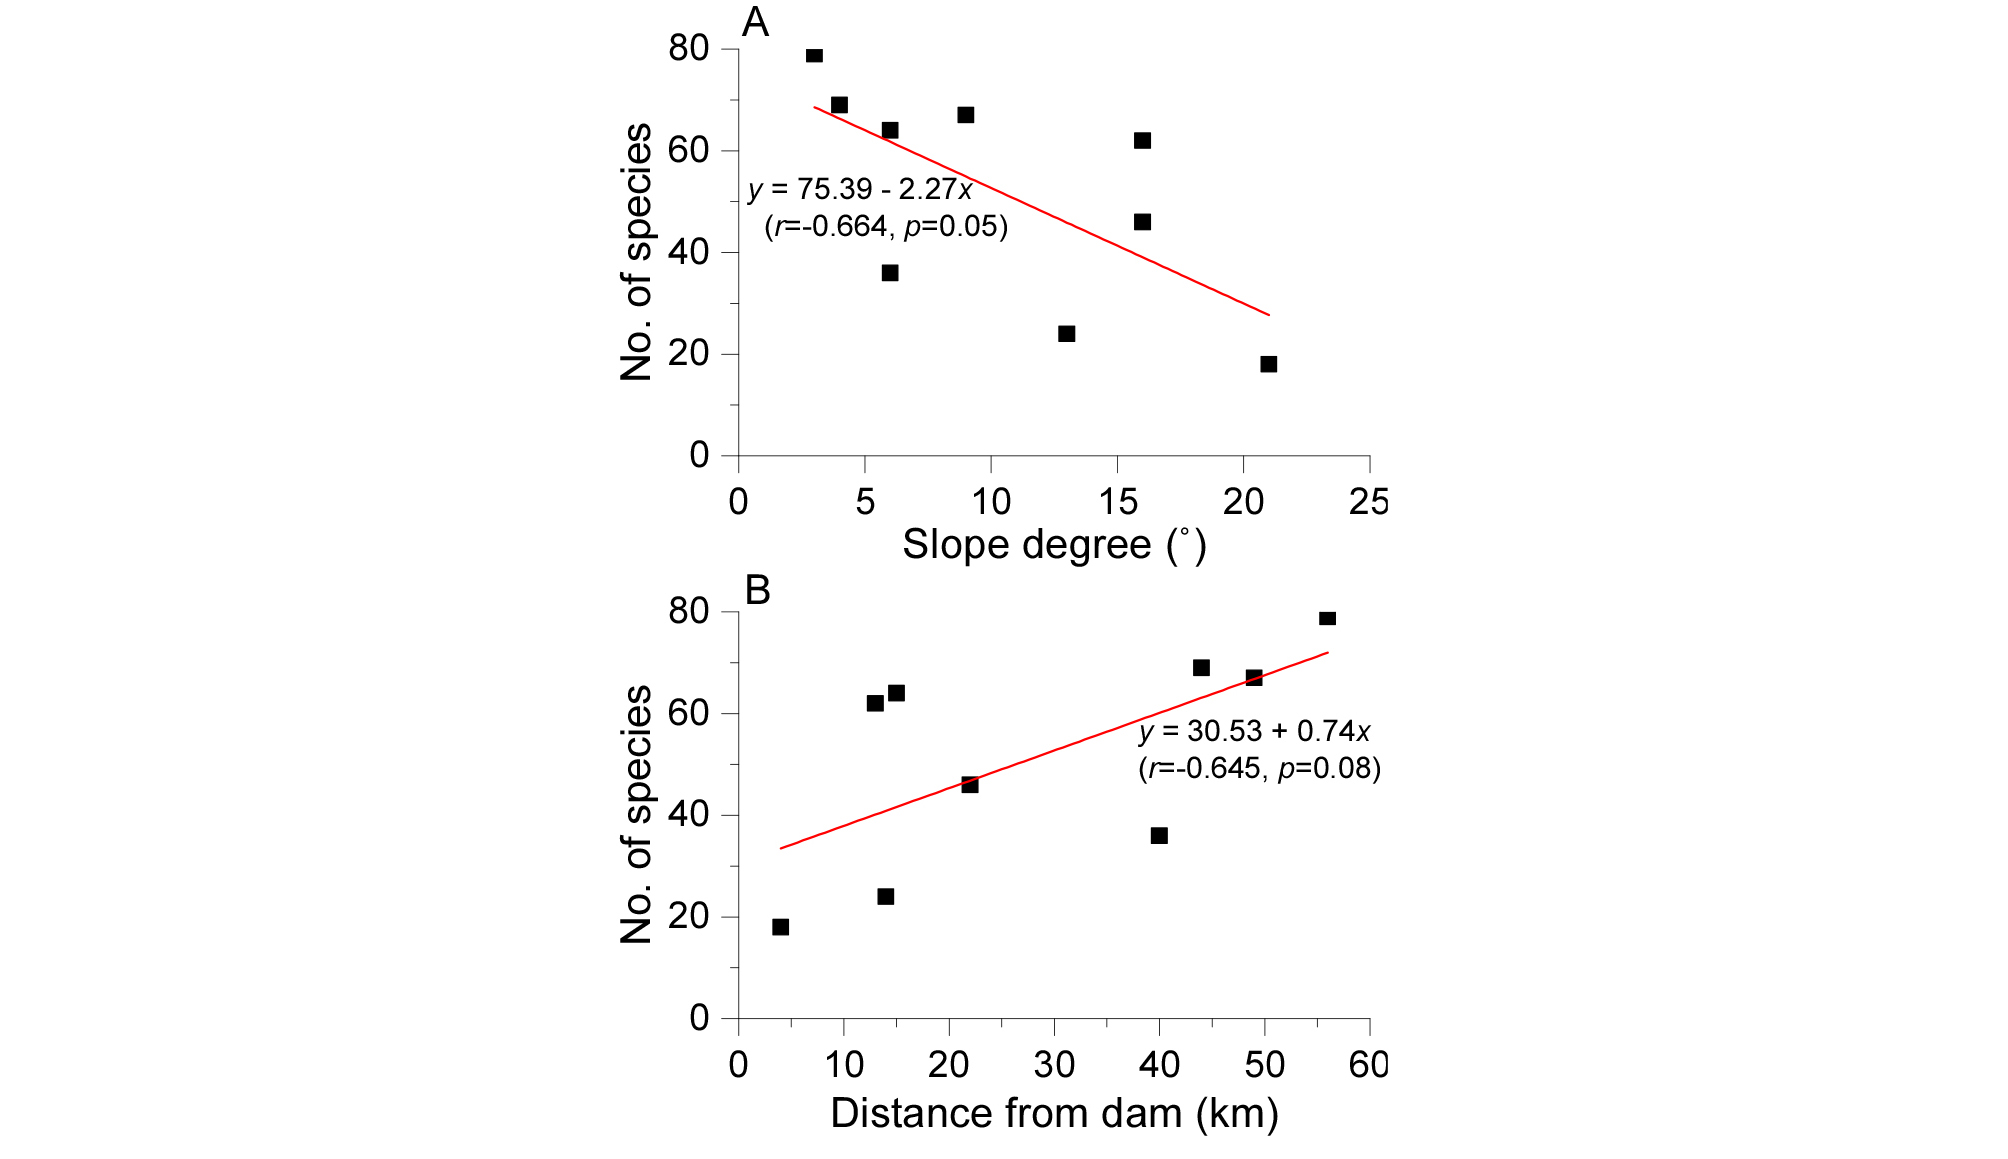
In the principal coordinates analysis (PCoA) axis 1 and 2 accounted for 46.9% and 22.8% of the total variation, respectively (Fig. 4). The slope angle and the distance from the dam were selected as the significant environmental factors correlated with the flora in the drawdown zone. The sites farthest from the dam and with gentle slopes were arranged at negative end of axis 1, and sites closest to the dam and with steep slopes were located at the positive end. Bromus japonicus, Carex orbicularis var. brachylepis, C. maackii, C. jaluensis, Hemistepta lyrata, usually described as hygrophytes preferring wet meadows, were found exclusively in the upstream part of the reservoir with gentle slopes (sites 1 and 2). On the other hand, Artemisia montana, Pilea japonica, Potentilla fragarioides var. major, species that are typically found in mountainous or valley forests, were present in the steep zone close to the dam (site 9). The results from the stepwise multiple regression indicated that slope degree and distance from the dam were significant variables related to species richness in the drawdown zone (Table 2 and Fig. 5).
3.2 Vegetation distribution
The plant communities in the upstream areas of the reservoir near the river inflows where there is a wide gentle drawdown zone (Fig. 6 (a)) include hygrophytic communities of B. frondosa, Echinochloa crus-galli, and P. trigonocarpa which were widely-distributed (Fig. 7 (a) and 7(b)). There was also some bare ground (unvegetated or <1% cover) not only on the steeper slopes, but also on the recently-exposed gentler slopes. In the narrow and steep drawdown zone near the dam where rocks and poor soils are vegetation colonization is poor (Fig. 6 (b)). Here, there was a wide, bare belt devoid of vegetation with infrequent ruderal communities of A. artemisiifolia, B. frondosa, P. nodosa, which were detected on the gentler slopes during a very short exposure period (Fig. 7 (c) and 7(d)).
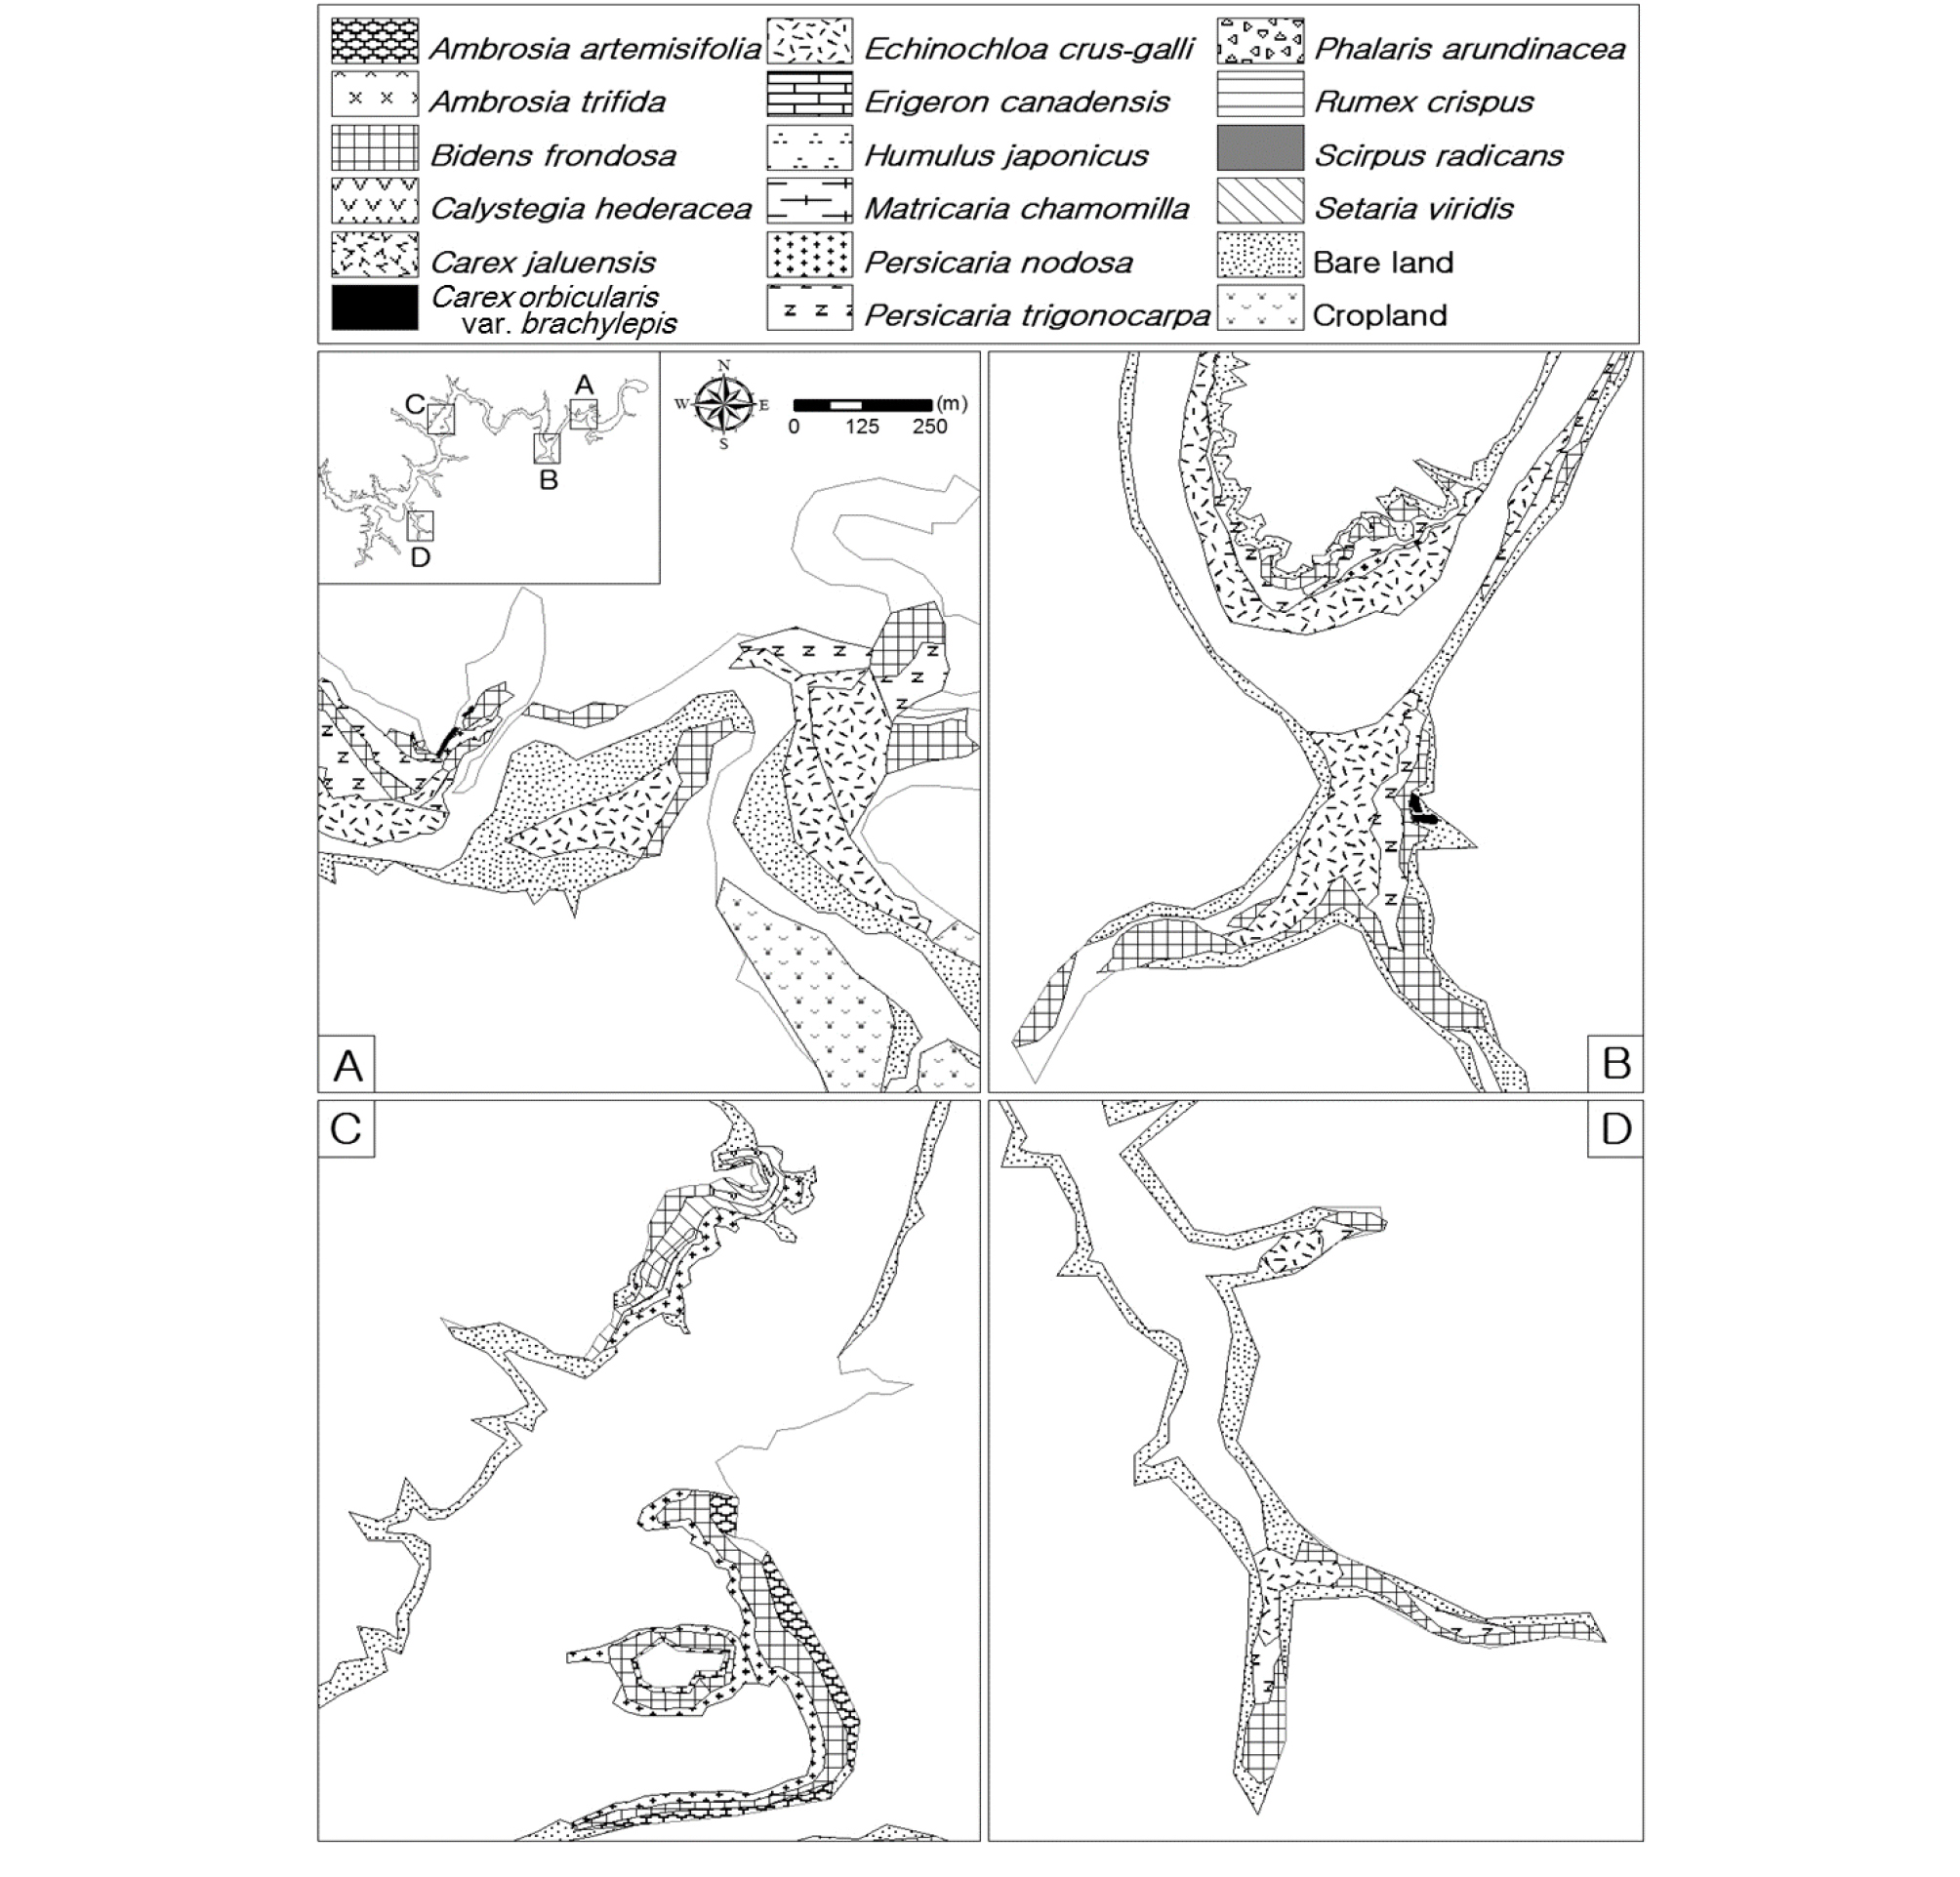
From the vegetation map, the total area of natural vegetation in the drawdown zone of the Soyangho Reservoir was estimated to be 119 ha (Table 3), this corresponded to 1.7% of the surface water area of the reservoir (7,000 ha). The distribution area of the B. frondosa and E. crus-galli communities covered the largest areas, 46 ha and 43 ha, 39% and 36% of the total, respectively. Communities dominated by P. trigonocarpa, P. nodosa and A. artemisiifolia occupied more than 2 ha. All the above communities were dominated by annuals that could complete their life cycles during the exposure period.
Table 3. Area occupied by each of the plant community types along with its above-ground biomass within the drawdown zone of the Soyangho Reservoir, South Korea. Mean values (±SD, n=10) are presented |
|
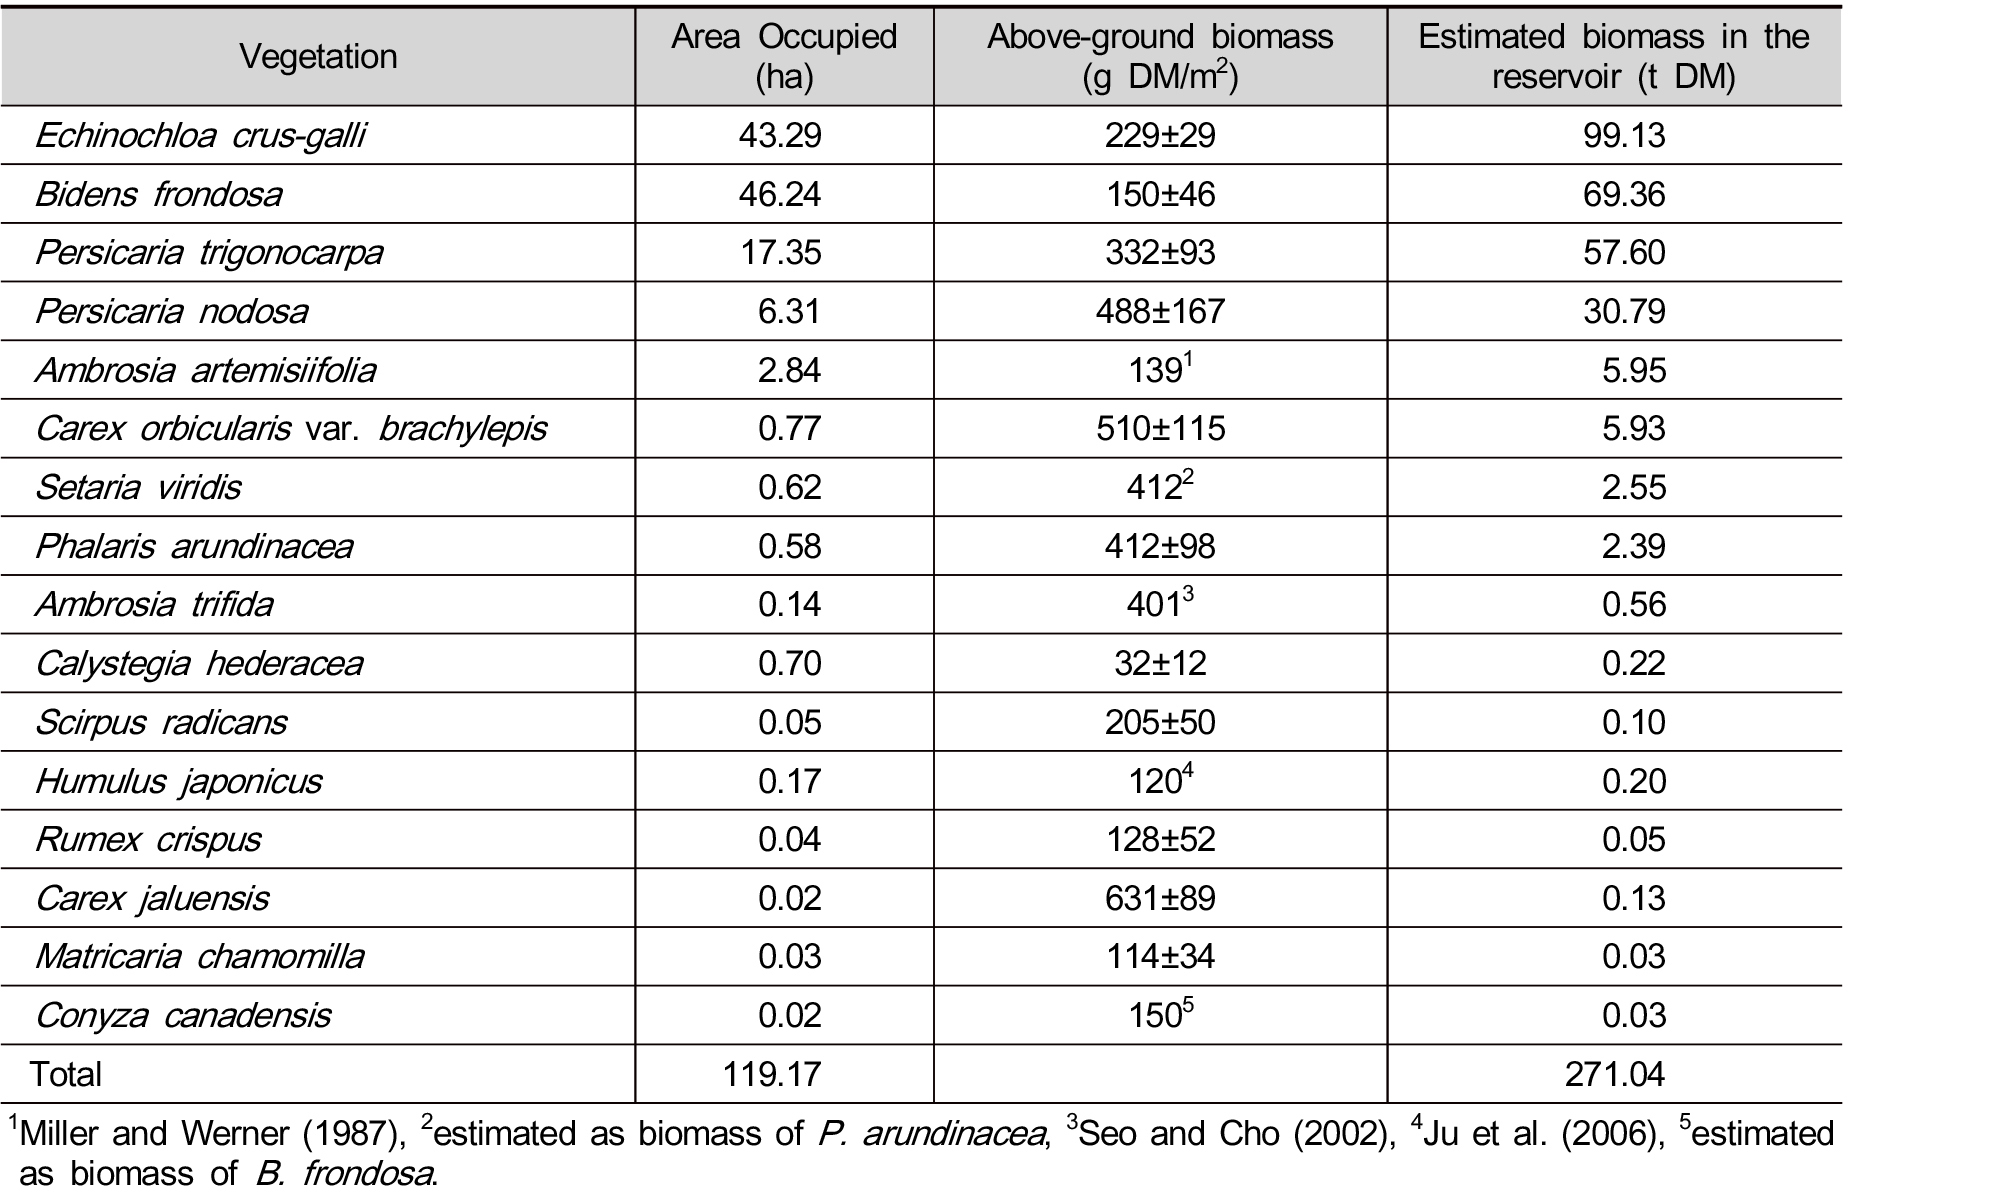
3.3 Phytomass
The range of biomass per unit area in the 11 plant communities measured in the drawdown zone of the reservoir ranged from 32 g DM/m2 in the C. hederacea community to 631 g DM/m2 in the Carex jaluensis one (Table 3). C. hederacea is a small liana expanding over ground after exposure in the mid-drawdown zone, and C. jaluensis is a tall grass with dense shoots at higher elevations in drawdown zone where flooding occurs for a short period. The biomass of vascular plants in the drawdown zone of the entire reservoir was estimated to 271 t DM (Table 3), with the E. crus-galli, B. frondosa, P. trigonocarpa, and P. nodosa communities contributing 95% of this total.
4. Discussion
4.1 Floristic characteristics of the reservoir drawdown zone
The drawdown zone, i.e., that area exposed and re-inundated as a result of water management operations, had an average annual water level fluctuation of 23 m between 1974 and 2017 (range 13 to 37 m) in the Soyangho Reservoir, one of the largest reservoirs in South Korea with a water surface area of 70 km2 (Korea Water Resources Corporation 2018). The floristic composition reflected this wide range of water level fluctuation with 141 species of vascular plants recorded in the drawdown zone of this reservoir. Species diversity was generally low in comparison with reservoirs elsewhere where fluctuations were very wide (Hill et al. 1998). Most species were herbaceous and more than half the species were short-lived species, annuals or biennials, i.e., those species that have evolved to respond to short periods of disturbance such as those created by exposure and the re-submergence within the drawdown zone (Lavorel et al. 1997, Song et al. 2015). Moreover, such short-lived species can complete their life cycles during the drawdown as they mainly regenerate from soil seed bank (Lu et al. 2010). Less than 10% of the total flora were woody species; these were mainly shrubs, and were scattered sporadically near the highest annual water level, where the submerged period was very short. Very few plant species can tolerate the extreme water level fluctuations in the harsh environment of the reservoir drawdown zone (Johansson and Nilsson 2002, Song et al. 2015).
Results of the principal coordinates analysis and multiple regression using both flora and environmental data showed that the slope angle and the distance from the dam were important factors determining floristic composition and species richness within the drawdown zone. The slope degree of the drawdown zone varies with the distance from dam; the nearer the dam, the greater the slope (R2=0.6146, p=0.0124, n=9). This occurs because the dam was built across a deep valley in a mountainous region; the area flooded included some side valleys with much shallower slopes. Therefore, the slope angle is considered to be the dominant factor on the floristic composition. The angle of the slope impacts on landslides, soil erosion, sedimentation and soil moisture conditions which combine to influence the flora of the drawdown zone (Yuan et al. 2013). In the Soyangho Reservoir, number of both hygrophytes and indeed all vascular plant species increased as the slope angle reduced, i.e., further away from the dam. Where the slope angle is high, soil erosion is increased by the force of the waves, the soil is not well developed; soil moisture is low, and a seed bank cannot be formed easily. Hence, this environment is not suitable for colonization and growth of plants, especially hygrophytes (Lu et al. 2010). Monitoring of floristic characteristics because flora can be used as an environmental indicator for hydrological alternations of reservoirs by changes in global climate and water resource demand (Ceschin et al. 2010, Ziaja et al. 2015).
4.2 Biomass of the drawdown zone vegetation
The biomass of the drawdown zone vegetation is closely related to the ecological roles of plants in reservoirs. We measured the area occupied and biomass per unit area of major plant communities to estimate total plant biomass in the entire drawdown zone of the Soyangho Reservoir. The bare land with almost no vegetation was widely-distributed on the steep slopes and in recently-exposed areas. Where the slope degree is high (above ca. 25°; Yuan et al. 2013) the parent bedrock can be exposed by soil erosion and vegetation colonization is low. This is enhanced by the short vegetation establishment period available in the Soyangho Reservoir. Sixteen plant communities were identified covering 119 ha of the drawdown zone, and of this 98% of species were annuals.
The above-ground biomass of the herbaceous communities varied from 32 to 631 g DM/m2 according to their growth forms and their locations in the drawdown zone. In the entire reservoir, communities of annuals accounted for 97% of above-ground biomass of 171 t DM. This biomass can be linked to ecological function of the vascular plants in the cycles of carbon, nitrogen and phosphorus in the reservoir. The vegetation of the drawdown zone functions as a carbon sink of ca 122 t C (assuming that C is 45% of dry weight; Ajtay et al. 1979), hence this reservoir vegetation plays a role in buffering the increase in atmospheric carbon (Yuan et al. 2013). In terms of the nutrient dynamics, the vegetation in the drawdown zone will contain ca 3.6 t N and ca 0.28 t P (assuming 13.3 mg N/g and 1.02 mg P/g; Güsewella and Koerselmanb 2002). The vegetation in the drawdown zone is, therefore a potential filter of pollutants that leach into the reservoir water. However, the vegetation can also take up inorganic nutrients from the soils and transfer them into the water body after flooding via decomposition (Barko and James 1998, Lu et al. 2018). Clearly, the transfers of nutrients between the external landscape and the reservoirs and internal soil-plant cycling needs further investigation to assess the contribution of the plants of the drawdown zone to the reservoir ecosystem function The Soyangho Reservoir has a large drawdown zone, with a maximum of annual water level fluctuation of 37 m between the lowest point, just before summer flood, and greatest after the flood. The exaggerated fluctuation of water level has caused distinct change in both species composition and plant communities within the drawdown zone. Species richness was low and species composition was dominated by herbaceous annuals due to disturbance from cycle of exposure and re-submergence in the drawdown zone, especially on steep slopes. Where the slope was steep and land had been recently exposed there were areas without vegetation or very spare vegetation. Even most vegetated area and above-ground biomass were occupied by annual plant communities. Where the the drawdown zone lacks vegetation the water level fluctuation has the potential to cause many environmental problems including landslides, soil erosion, water pollution, biodiversity loss, carbon sink decrease, and other issues (Yuan et al. 2013). Therefore, the vegetation map and above-ground biomass results from this study can be used as to inform management of the vegetation within the drawdown zone and as a baseline for monitoring change in soil stabilization, water quality control, biodiversity conservation, carbon sink enhancement in the Soyangho Reservoir.
